Immigrants from Northern Europe vs Welsh In Labor Force | Age 20-24
COMPARE
Immigrants from Northern Europe
Welsh
In Labor Force | Age 20-24
In Labor Force | Age 20-24 Comparison
Immigrants from Northern Europe
Welsh
74.8%
IN LABOR FORCE | AGE 20-24
32.6/ 100
METRIC RATING
189th/ 347
METRIC RANK
77.5%
IN LABOR FORCE | AGE 20-24
100.0/ 100
METRIC RATING
36th/ 347
METRIC RANK
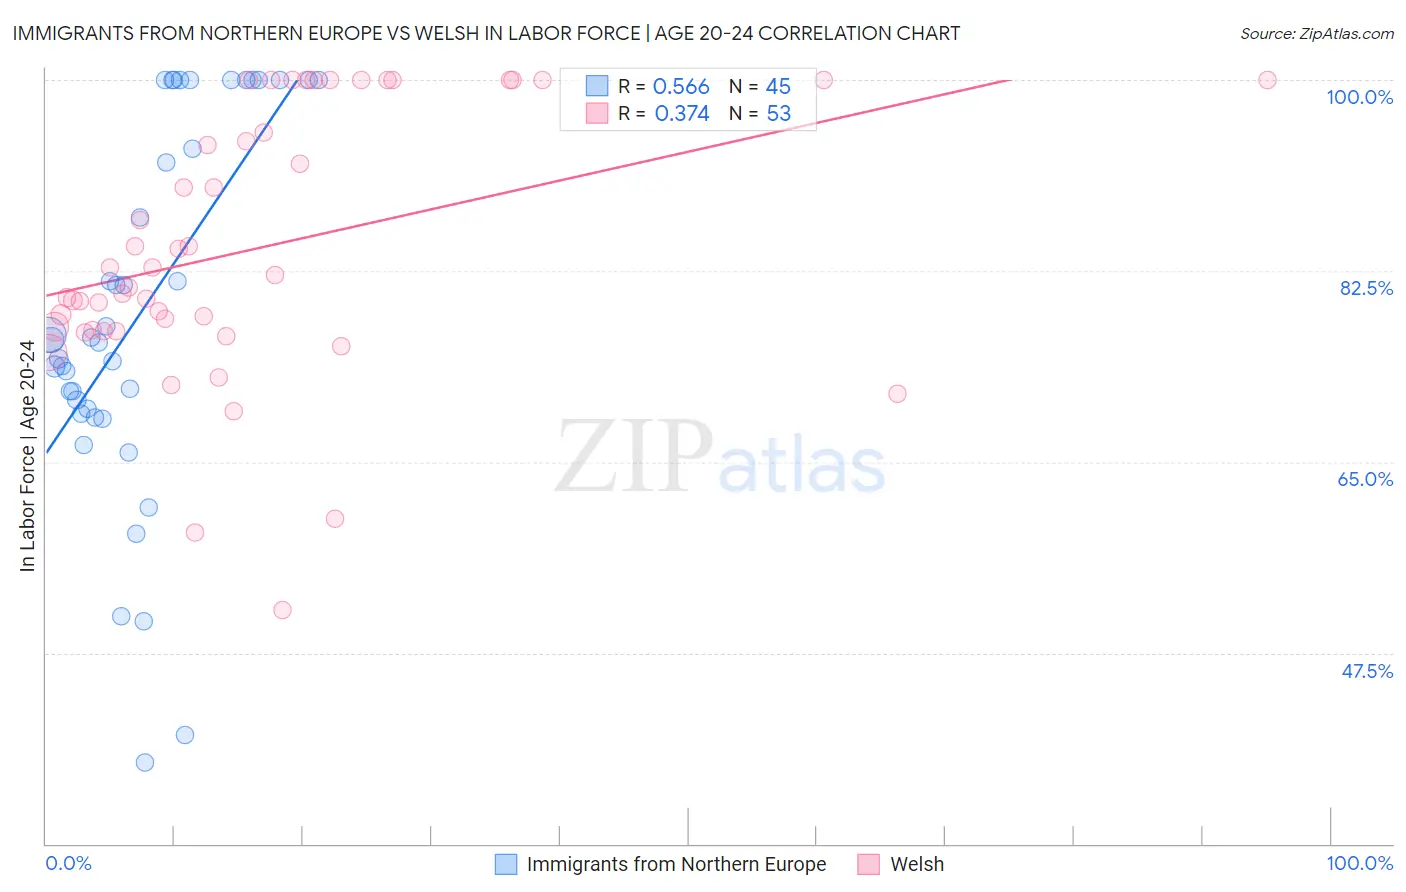
Immigrants from Northern Europe vs Welsh In Labor Force | Age 20-24 Correlation Chart
The statistical analysis conducted on geographies consisting of 476,778,788 people shows a substantial positive correlation between the proportion of Immigrants from Northern Europe and labor force participation rate among population between the ages 20 and 24 in the United States with a correlation coefficient (R) of 0.566 and weighted average of 74.8%. Similarly, the statistical analysis conducted on geographies consisting of 527,767,201 people shows a mild positive correlation between the proportion of Welsh and labor force participation rate among population between the ages 20 and 24 in the United States with a correlation coefficient (R) of 0.374 and weighted average of 77.5%, a difference of 3.5%.
In Labor Force | Age 20-24 Correlation Summary
| Measurement | Immigrants from Northern Europe | Welsh |
| Minimum | 37.5% | 51.4% |
| Maximum | 100.0% | 100.0% |
| Range | 62.5% | 48.6% |
| Mean | 78.8% | 84.7% |
| Median | 76.1% | 82.1% |
| Interquartile 25% (IQ1) | 69.6% | 77.1% |
| Interquartile 75% (IQ3) | 100.0% | 100.0% |
| Interquartile Range (IQR) | 30.4% | 22.9% |
| Standard Deviation (Sample) | 16.9% | 12.1% |
| Standard Deviation (Population) | 16.7% | 12.0% |
Similar Demographics by In Labor Force | Age 20-24
Demographics Similar to Immigrants from Northern Europe by In Labor Force | Age 20-24
In terms of in labor force | age 20-24, the demographic groups most similar to Immigrants from Northern Europe are Honduran (74.8%, a difference of 0.0%), Immigrants from Honduras (74.9%, a difference of 0.010%), Russian (74.8%, a difference of 0.010%), Immigrants from Eastern Europe (74.9%, a difference of 0.020%), and Immigrants from Hungary (74.9%, a difference of 0.040%).
| Demographics | Rating | Rank | In Labor Force | Age 20-24 |
| Immigrants | South Africa | 36.9 /100 | #182 | Fair 74.9% |
| Immigrants | Costa Rica | 36.7 /100 | #183 | Fair 74.9% |
| Immigrants | Hungary | 35.0 /100 | #184 | Fair 74.9% |
| Sri Lankans | 34.9 /100 | #185 | Fair 74.9% |
| Immigrants | Eastern Europe | 33.8 /100 | #186 | Fair 74.9% |
| Immigrants | Honduras | 33.5 /100 | #187 | Fair 74.9% |
| Hondurans | 32.7 /100 | #188 | Fair 74.8% |
| Immigrants | Northern Europe | 32.6 /100 | #189 | Fair 74.8% |
| Russians | 32.2 /100 | #190 | Fair 74.8% |
| Senegalese | 28.1 /100 | #191 | Fair 74.8% |
| Immigrants | Europe | 27.5 /100 | #192 | Fair 74.8% |
| Alsatians | 27.1 /100 | #193 | Fair 74.8% |
| Immigrants | Denmark | 25.8 /100 | #194 | Fair 74.8% |
| Eastern Europeans | 25.4 /100 | #195 | Fair 74.8% |
| Immigrants | Vietnam | 25.1 /100 | #196 | Fair 74.7% |
Demographics Similar to Welsh by In Labor Force | Age 20-24
In terms of in labor force | age 20-24, the demographic groups most similar to Welsh are Czechoslovakian (77.5%, a difference of 0.010%), Immigrants from Eastern Africa (77.5%, a difference of 0.020%), German Russian (77.5%, a difference of 0.030%), Immigrants from Ethiopia (77.5%, a difference of 0.040%), and Marshallese (77.4%, a difference of 0.070%).
| Demographics | Rating | Rank | In Labor Force | Age 20-24 |
| Slovaks | 100.0 /100 | #29 | Exceptional 77.7% |
| Swiss | 100.0 /100 | #30 | Exceptional 77.7% |
| Poles | 100.0 /100 | #31 | Exceptional 77.6% |
| English | 100.0 /100 | #32 | Exceptional 77.6% |
| Immigrants | Ethiopia | 100.0 /100 | #33 | Exceptional 77.5% |
| German Russians | 100.0 /100 | #34 | Exceptional 77.5% |
| Immigrants | Eastern Africa | 100.0 /100 | #35 | Exceptional 77.5% |
| Welsh | 100.0 /100 | #36 | Exceptional 77.5% |
| Czechoslovakians | 100.0 /100 | #37 | Exceptional 77.5% |
| Marshallese | 100.0 /100 | #38 | Exceptional 77.4% |
| Irish | 100.0 /100 | #39 | Exceptional 77.4% |
| Scottish | 100.0 /100 | #40 | Exceptional 77.4% |
| Immigrants | Congo | 100.0 /100 | #41 | Exceptional 77.4% |
| French | 100.0 /100 | #42 | Exceptional 77.4% |
| Immigrants | Laos | 100.0 /100 | #43 | Exceptional 77.4% |