Immigrants from Northern Europe vs Welsh Female Unemployment
COMPARE
Immigrants from Northern Europe
Welsh
Female Unemployment
Female Unemployment Comparison
Immigrants from Northern Europe
Welsh
4.9%
FEMALE UNEMPLOYMENT
98.0/ 100
METRIC RATING
72nd/ 347
METRIC RANK
4.7%
FEMALE UNEMPLOYMENT
99.9/ 100
METRIC RATING
24th/ 347
METRIC RANK
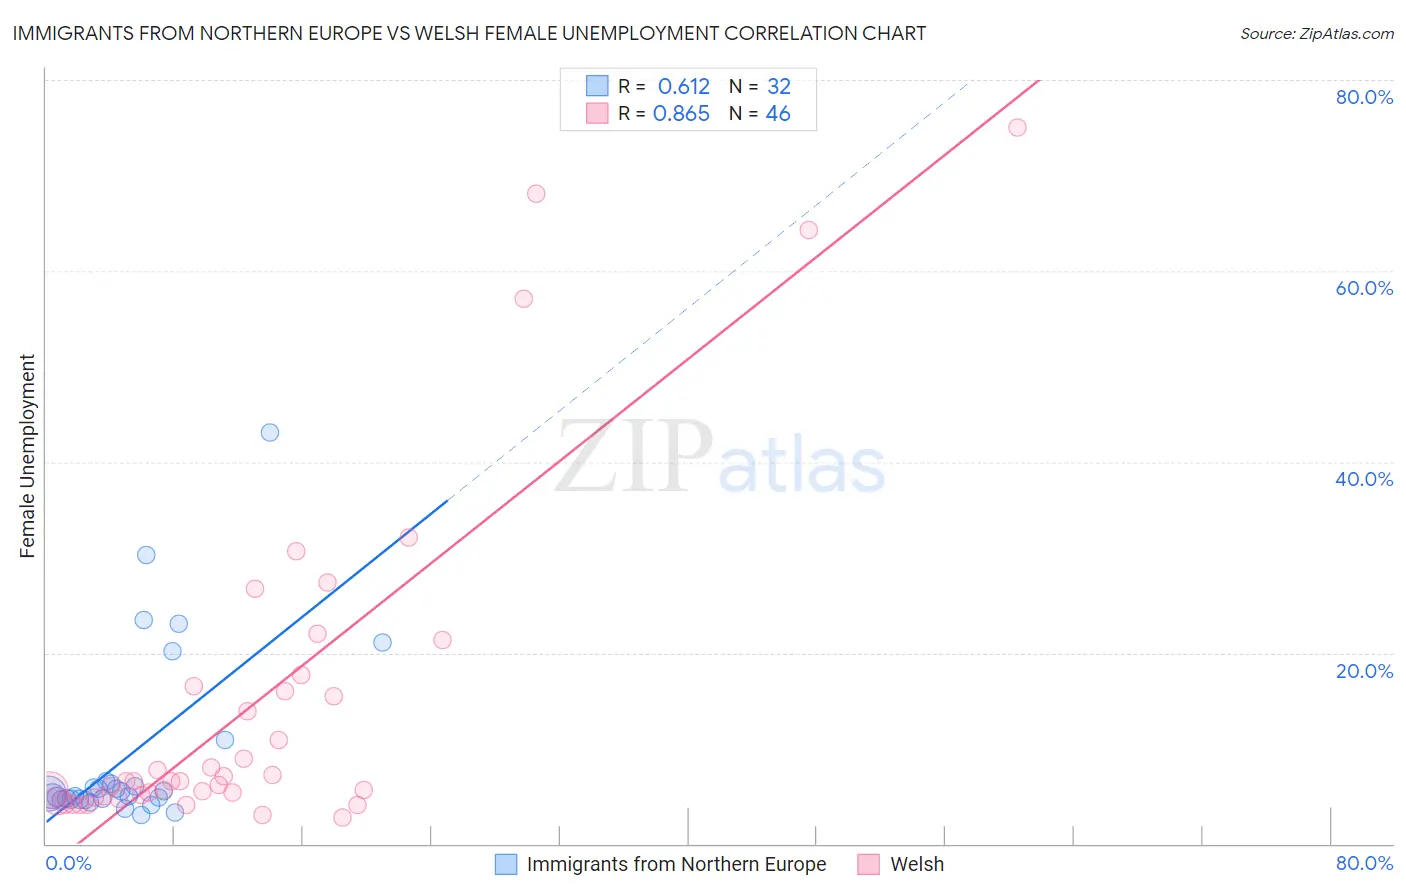
Immigrants from Northern Europe vs Welsh Female Unemployment Correlation Chart
The statistical analysis conducted on geographies consisting of 473,051,812 people shows a significant positive correlation between the proportion of Immigrants from Northern Europe and unemploymnet rate among females in the United States with a correlation coefficient (R) of 0.612 and weighted average of 4.9%. Similarly, the statistical analysis conducted on geographies consisting of 519,058,145 people shows a very strong positive correlation between the proportion of Welsh and unemploymnet rate among females in the United States with a correlation coefficient (R) of 0.865 and weighted average of 4.7%, a difference of 4.8%.
Female Unemployment Correlation Summary
| Measurement | Immigrants from Northern Europe | Welsh |
| Minimum | 3.0% | 2.8% |
| Maximum | 43.1% | 75.0% |
| Range | 40.1% | 72.2% |
| Mean | 9.2% | 14.8% |
| Median | 5.1% | 6.5% |
| Interquartile 25% (IQ1) | 4.7% | 5.0% |
| Interquartile 75% (IQ3) | 6.4% | 16.5% |
| Interquartile Range (IQR) | 1.7% | 11.5% |
| Standard Deviation (Sample) | 9.4% | 17.8% |
| Standard Deviation (Population) | 9.2% | 17.7% |
Similar Demographics by Female Unemployment
Demographics Similar to Immigrants from Northern Europe by Female Unemployment
In terms of female unemployment, the demographic groups most similar to Immigrants from Northern Europe are Russian (5.0%, a difference of 0.030%), Immigrants from Bolivia (5.0%, a difference of 0.040%), Immigrants from Singapore (5.0%, a difference of 0.060%), German Russian (4.9%, a difference of 0.070%), and Immigrants from Venezuela (5.0%, a difference of 0.070%).
| Demographics | Rating | Rank | Female Unemployment |
| Immigrants | North America | 98.3 /100 | #65 | Exceptional 4.9% |
| Hungarians | 98.3 /100 | #66 | Exceptional 4.9% |
| Cubans | 98.3 /100 | #67 | Exceptional 4.9% |
| Tlingit-Haida | 98.3 /100 | #68 | Exceptional 4.9% |
| Immigrants | Ireland | 98.2 /100 | #69 | Exceptional 4.9% |
| Osage | 98.2 /100 | #70 | Exceptional 4.9% |
| German Russians | 98.1 /100 | #71 | Exceptional 4.9% |
| Immigrants | Northern Europe | 98.0 /100 | #72 | Exceptional 4.9% |
| Russians | 98.0 /100 | #73 | Exceptional 5.0% |
| Immigrants | Bolivia | 98.0 /100 | #74 | Exceptional 5.0% |
| Immigrants | Singapore | 98.0 /100 | #75 | Exceptional 5.0% |
| Immigrants | Venezuela | 97.9 /100 | #76 | Exceptional 5.0% |
| Mongolians | 97.8 /100 | #77 | Exceptional 5.0% |
| Immigrants | Netherlands | 97.8 /100 | #78 | Exceptional 5.0% |
| Turks | 97.6 /100 | #79 | Exceptional 5.0% |
Demographics Similar to Welsh by Female Unemployment
In terms of female unemployment, the demographic groups most similar to Welsh are Immigrants from India (4.7%, a difference of 0.090%), Immigrants from Bosnia and Herzegovina (4.7%, a difference of 0.13%), Scottish (4.7%, a difference of 0.21%), British (4.7%, a difference of 0.29%), and Irish (4.7%, a difference of 0.32%).
| Demographics | Rating | Rank | Female Unemployment |
| Croatians | 99.9 /100 | #17 | Exceptional 4.7% |
| Latvians | 99.9 /100 | #18 | Exceptional 4.7% |
| Poles | 99.9 /100 | #19 | Exceptional 4.7% |
| Bulgarians | 99.9 /100 | #20 | Exceptional 4.7% |
| Fijians | 99.9 /100 | #21 | Exceptional 4.7% |
| Europeans | 99.9 /100 | #22 | Exceptional 4.7% |
| Scottish | 99.9 /100 | #23 | Exceptional 4.7% |
| Welsh | 99.9 /100 | #24 | Exceptional 4.7% |
| Immigrants | India | 99.9 /100 | #25 | Exceptional 4.7% |
| Immigrants | Bosnia and Herzegovina | 99.9 /100 | #26 | Exceptional 4.7% |
| British | 99.9 /100 | #27 | Exceptional 4.7% |
| Irish | 99.9 /100 | #28 | Exceptional 4.7% |
| Cypriots | 99.9 /100 | #29 | Exceptional 4.7% |
| Lithuanians | 99.8 /100 | #30 | Exceptional 4.7% |
| Sudanese | 99.8 /100 | #31 | Exceptional 4.8% |