Immigrants from Nigeria vs Comanche Male Poverty
COMPARE
Immigrants from Nigeria
Comanche
Male Poverty
Male Poverty Comparison
Immigrants from Nigeria
Comanche
12.3%
MALE POVERTY
1.6/ 100
METRIC RATING
224th/ 347
METRIC RANK
13.8%
MALE POVERTY
0.0/ 100
METRIC RATING
283rd/ 347
METRIC RANK
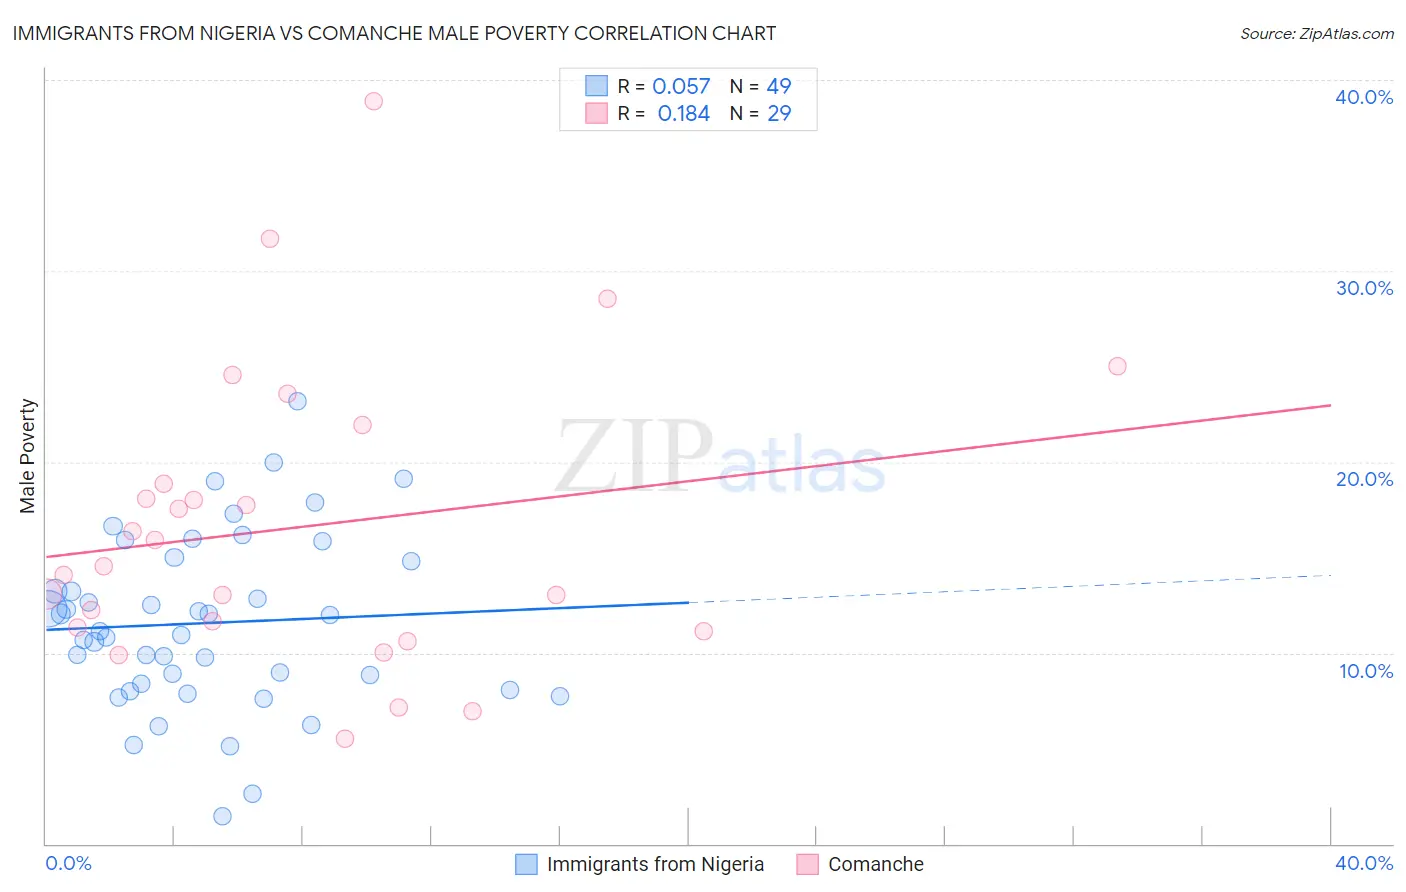
Immigrants from Nigeria vs Comanche Male Poverty Correlation Chart
The statistical analysis conducted on geographies consisting of 283,241,379 people shows a slight positive correlation between the proportion of Immigrants from Nigeria and poverty level among males in the United States with a correlation coefficient (R) of 0.057 and weighted average of 12.3%. Similarly, the statistical analysis conducted on geographies consisting of 109,752,173 people shows a poor positive correlation between the proportion of Comanche and poverty level among males in the United States with a correlation coefficient (R) of 0.184 and weighted average of 13.8%, a difference of 11.6%.
Male Poverty Correlation Summary
| Measurement | Immigrants from Nigeria | Comanche |
| Minimum | 1.4% | 5.5% |
| Maximum | 23.1% | 38.9% |
| Range | 21.7% | 33.4% |
| Mean | 11.6% | 16.6% |
| Median | 11.1% | 14.6% |
| Interquartile 25% (IQ1) | 8.2% | 11.2% |
| Interquartile 75% (IQ3) | 14.9% | 20.4% |
| Interquartile Range (IQR) | 6.7% | 9.2% |
| Standard Deviation (Sample) | 4.5% | 7.7% |
| Standard Deviation (Population) | 4.5% | 7.6% |
Similar Demographics by Male Poverty
Demographics Similar to Immigrants from Nigeria by Male Poverty
In terms of male poverty, the demographic groups most similar to Immigrants from Nigeria are Osage (12.3%, a difference of 0.060%), Nigerian (12.3%, a difference of 0.22%), Alaska Native (12.4%, a difference of 0.32%), Alsatian (12.4%, a difference of 0.36%), and Cuban (12.4%, a difference of 0.45%).
| Demographics | Rating | Rank | Male Poverty |
| Immigrants | Thailand | 2.5 /100 | #217 | Tragic 12.2% |
| German Russians | 2.5 /100 | #218 | Tragic 12.2% |
| Bermudans | 2.4 /100 | #219 | Tragic 12.2% |
| Immigrants | Eritrea | 2.4 /100 | #220 | Tragic 12.2% |
| Ugandans | 2.2 /100 | #221 | Tragic 12.2% |
| Immigrants | Africa | 2.1 /100 | #222 | Tragic 12.2% |
| Immigrants | Micronesia | 2.1 /100 | #223 | Tragic 12.2% |
| Immigrants | Nigeria | 1.6 /100 | #224 | Tragic 12.3% |
| Osage | 1.5 /100 | #225 | Tragic 12.3% |
| Nigerians | 1.4 /100 | #226 | Tragic 12.3% |
| Alaska Natives | 1.4 /100 | #227 | Tragic 12.4% |
| Alsatians | 1.3 /100 | #228 | Tragic 12.4% |
| Cubans | 1.3 /100 | #229 | Tragic 12.4% |
| Marshallese | 0.8 /100 | #230 | Tragic 12.5% |
| Salvadorans | 0.6 /100 | #231 | Tragic 12.6% |
Demographics Similar to Comanche by Male Poverty
In terms of male poverty, the demographic groups most similar to Comanche are Immigrants from Haiti (13.8%, a difference of 0.010%), West Indian (13.8%, a difference of 0.020%), Shoshone (13.8%, a difference of 0.050%), Immigrants from Barbados (13.8%, a difference of 0.070%), and Immigrants from Cabo Verde (13.7%, a difference of 0.20%).
| Demographics | Rating | Rank | Male Poverty |
| Immigrants | Latin America | 0.0 /100 | #276 | Tragic 13.6% |
| Bangladeshis | 0.0 /100 | #277 | Tragic 13.6% |
| Belizeans | 0.0 /100 | #278 | Tragic 13.6% |
| Haitians | 0.0 /100 | #279 | Tragic 13.7% |
| Mexicans | 0.0 /100 | #280 | Tragic 13.7% |
| Yaqui | 0.0 /100 | #281 | Tragic 13.7% |
| Immigrants | Cabo Verde | 0.0 /100 | #282 | Tragic 13.7% |
| Comanche | 0.0 /100 | #283 | Tragic 13.8% |
| Immigrants | Haiti | 0.0 /100 | #284 | Tragic 13.8% |
| West Indians | 0.0 /100 | #285 | Tragic 13.8% |
| Shoshone | 0.0 /100 | #286 | Tragic 13.8% |
| Immigrants | Barbados | 0.0 /100 | #287 | Tragic 13.8% |
| Immigrants | St. Vincent and the Grenadines | 0.0 /100 | #288 | Tragic 13.8% |
| Guatemalans | 0.0 /100 | #289 | Tragic 13.8% |
| Immigrants | Zaire | 0.0 /100 | #290 | Tragic 13.8% |