Immigrants from Nigeria vs African Male Poverty
COMPARE
Immigrants from Nigeria
African
Male Poverty
Male Poverty Comparison
Immigrants from Nigeria
Africans
12.3%
MALE POVERTY
1.6/ 100
METRIC RATING
224th/ 347
METRIC RANK
14.2%
MALE POVERTY
0.0/ 100
METRIC RATING
308th/ 347
METRIC RANK
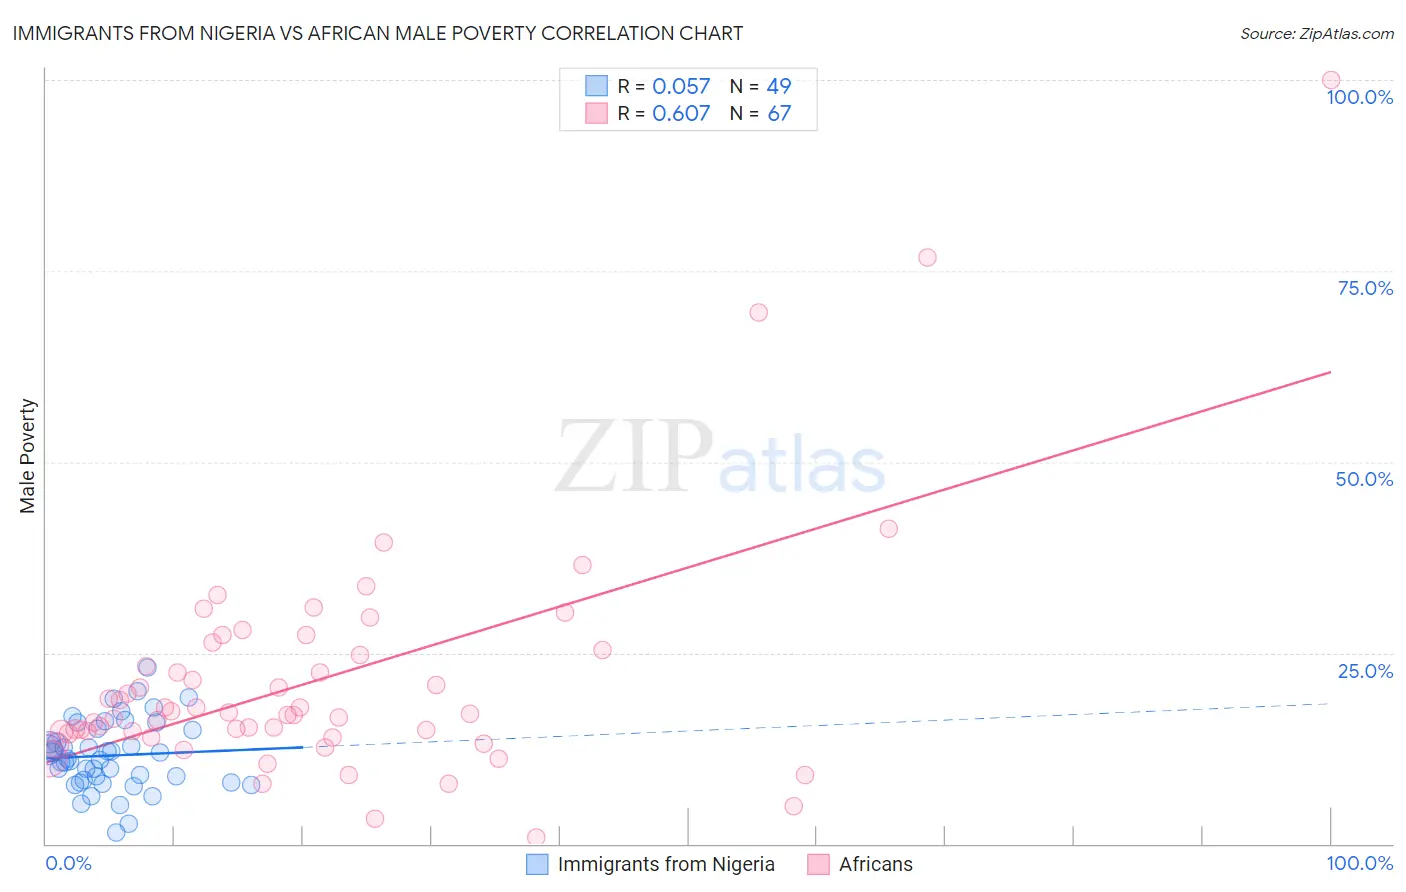
Immigrants from Nigeria vs African Male Poverty Correlation Chart
The statistical analysis conducted on geographies consisting of 283,241,379 people shows a slight positive correlation between the proportion of Immigrants from Nigeria and poverty level among males in the United States with a correlation coefficient (R) of 0.057 and weighted average of 12.3%. Similarly, the statistical analysis conducted on geographies consisting of 469,483,422 people shows a significant positive correlation between the proportion of Africans and poverty level among males in the United States with a correlation coefficient (R) of 0.607 and weighted average of 14.2%, a difference of 15.3%.
Male Poverty Correlation Summary
| Measurement | Immigrants from Nigeria | African |
| Minimum | 1.4% | 0.81% |
| Maximum | 23.1% | 100.0% |
| Range | 21.7% | 99.2% |
| Mean | 11.6% | 21.5% |
| Median | 11.1% | 17.0% |
| Interquartile 25% (IQ1) | 8.2% | 14.4% |
| Interquartile 75% (IQ3) | 14.9% | 25.4% |
| Interquartile Range (IQR) | 6.7% | 10.9% |
| Standard Deviation (Sample) | 4.5% | 15.8% |
| Standard Deviation (Population) | 4.5% | 15.7% |
Similar Demographics by Male Poverty
Demographics Similar to Immigrants from Nigeria by Male Poverty
In terms of male poverty, the demographic groups most similar to Immigrants from Nigeria are Osage (12.3%, a difference of 0.060%), Nigerian (12.3%, a difference of 0.22%), Alaska Native (12.4%, a difference of 0.32%), Alsatian (12.4%, a difference of 0.36%), and Cuban (12.4%, a difference of 0.45%).
| Demographics | Rating | Rank | Male Poverty |
| Immigrants | Thailand | 2.5 /100 | #217 | Tragic 12.2% |
| German Russians | 2.5 /100 | #218 | Tragic 12.2% |
| Bermudans | 2.4 /100 | #219 | Tragic 12.2% |
| Immigrants | Eritrea | 2.4 /100 | #220 | Tragic 12.2% |
| Ugandans | 2.2 /100 | #221 | Tragic 12.2% |
| Immigrants | Africa | 2.1 /100 | #222 | Tragic 12.2% |
| Immigrants | Micronesia | 2.1 /100 | #223 | Tragic 12.2% |
| Immigrants | Nigeria | 1.6 /100 | #224 | Tragic 12.3% |
| Osage | 1.5 /100 | #225 | Tragic 12.3% |
| Nigerians | 1.4 /100 | #226 | Tragic 12.3% |
| Alaska Natives | 1.4 /100 | #227 | Tragic 12.4% |
| Alsatians | 1.3 /100 | #228 | Tragic 12.4% |
| Cubans | 1.3 /100 | #229 | Tragic 12.4% |
| Marshallese | 0.8 /100 | #230 | Tragic 12.5% |
| Salvadorans | 0.6 /100 | #231 | Tragic 12.6% |
Demographics Similar to Africans by Male Poverty
In terms of male poverty, the demographic groups most similar to Africans are Dutch West Indian (14.2%, a difference of 0.020%), Somali (14.3%, a difference of 0.38%), Seminole (14.3%, a difference of 0.58%), Creek (14.1%, a difference of 0.71%), and Immigrants from Bangladesh (14.1%, a difference of 0.78%).
| Demographics | Rating | Rank | Male Poverty |
| Immigrants | Senegal | 0.0 /100 | #301 | Tragic 14.0% |
| Immigrants | Caribbean | 0.0 /100 | #302 | Tragic 14.0% |
| Bahamians | 0.0 /100 | #303 | Tragic 14.1% |
| Senegalese | 0.0 /100 | #304 | Tragic 14.1% |
| Immigrants | Bangladesh | 0.0 /100 | #305 | Tragic 14.1% |
| Creek | 0.0 /100 | #306 | Tragic 14.1% |
| Dutch West Indians | 0.0 /100 | #307 | Tragic 14.2% |
| Africans | 0.0 /100 | #308 | Tragic 14.2% |
| Somalis | 0.0 /100 | #309 | Tragic 14.3% |
| Seminole | 0.0 /100 | #310 | Tragic 14.3% |
| Hondurans | 0.0 /100 | #311 | Tragic 14.3% |
| Choctaw | 0.0 /100 | #312 | Tragic 14.4% |
| Immigrants | Somalia | 0.0 /100 | #313 | Tragic 14.6% |
| Immigrants | Honduras | 0.0 /100 | #314 | Tragic 14.6% |
| Chippewa | 0.0 /100 | #315 | Tragic 14.6% |