Immigrants from Nigeria vs Immigrants from Ireland Male Poverty
COMPARE
Immigrants from Nigeria
Immigrants from Ireland
Male Poverty
Male Poverty Comparison
Immigrants from Nigeria
Immigrants from Ireland
12.3%
MALE POVERTY
1.6/ 100
METRIC RATING
224th/ 347
METRIC RANK
9.1%
MALE POVERTY
99.9/ 100
METRIC RATING
7th/ 347
METRIC RANK
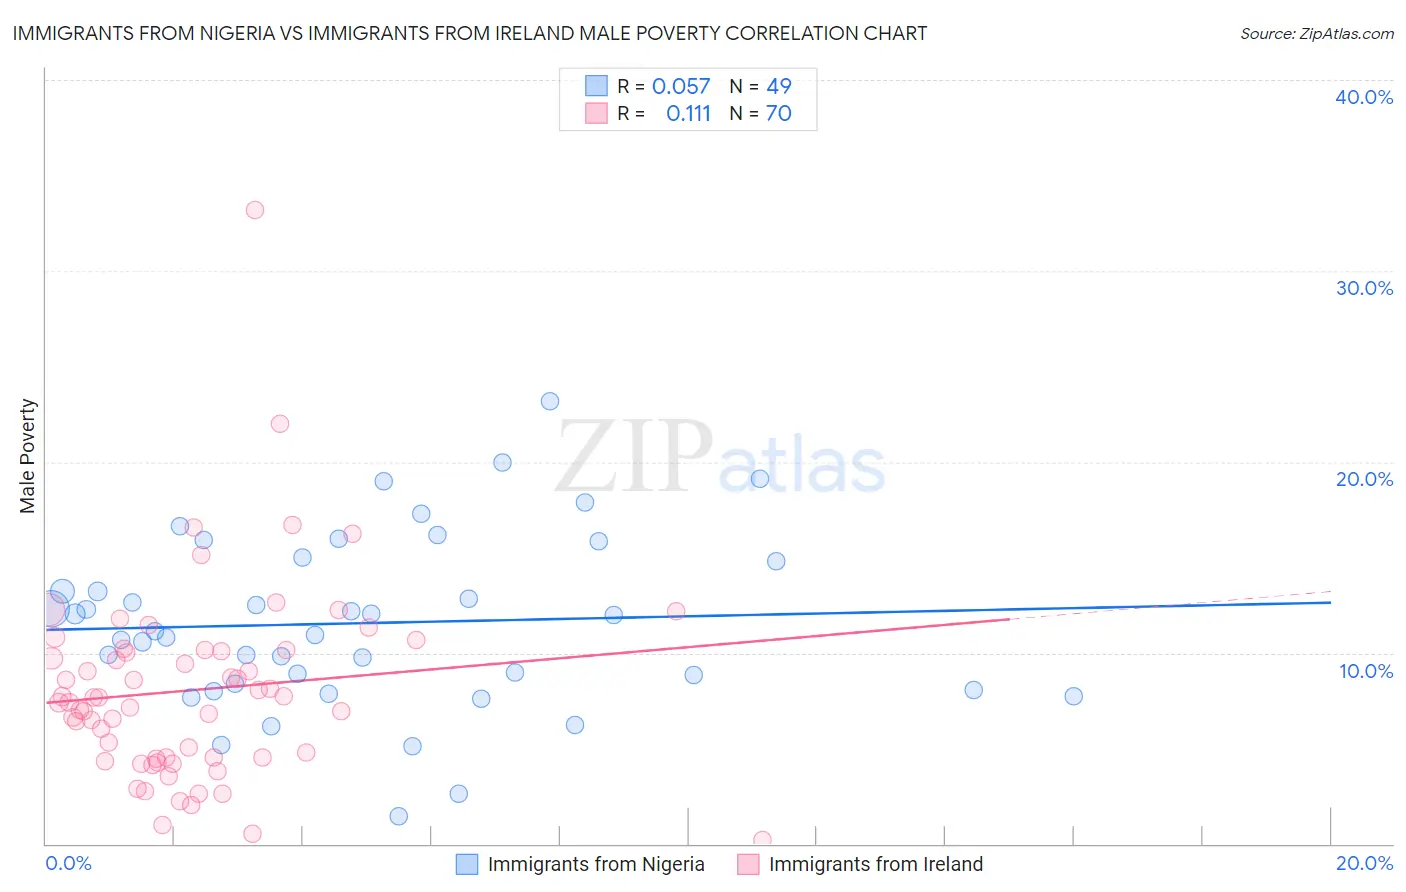
Immigrants from Nigeria vs Immigrants from Ireland Male Poverty Correlation Chart
The statistical analysis conducted on geographies consisting of 283,241,379 people shows a slight positive correlation between the proportion of Immigrants from Nigeria and poverty level among males in the United States with a correlation coefficient (R) of 0.057 and weighted average of 12.3%. Similarly, the statistical analysis conducted on geographies consisting of 240,683,181 people shows a poor positive correlation between the proportion of Immigrants from Ireland and poverty level among males in the United States with a correlation coefficient (R) of 0.111 and weighted average of 9.1%, a difference of 34.8%.
Male Poverty Correlation Summary
| Measurement | Immigrants from Nigeria | Immigrants from Ireland |
| Minimum | 1.4% | 0.22% |
| Maximum | 23.1% | 33.2% |
| Range | 21.7% | 33.0% |
| Mean | 11.6% | 8.1% |
| Median | 11.1% | 7.5% |
| Interquartile 25% (IQ1) | 8.2% | 4.5% |
| Interquartile 75% (IQ3) | 14.9% | 10.1% |
| Interquartile Range (IQR) | 6.7% | 5.6% |
| Standard Deviation (Sample) | 4.5% | 5.1% |
| Standard Deviation (Population) | 4.5% | 5.1% |
Similar Demographics by Male Poverty
Demographics Similar to Immigrants from Nigeria by Male Poverty
In terms of male poverty, the demographic groups most similar to Immigrants from Nigeria are Osage (12.3%, a difference of 0.060%), Nigerian (12.3%, a difference of 0.22%), Alaska Native (12.4%, a difference of 0.32%), Alsatian (12.4%, a difference of 0.36%), and Cuban (12.4%, a difference of 0.45%).
| Demographics | Rating | Rank | Male Poverty |
| Immigrants | Thailand | 2.5 /100 | #217 | Tragic 12.2% |
| German Russians | 2.5 /100 | #218 | Tragic 12.2% |
| Bermudans | 2.4 /100 | #219 | Tragic 12.2% |
| Immigrants | Eritrea | 2.4 /100 | #220 | Tragic 12.2% |
| Ugandans | 2.2 /100 | #221 | Tragic 12.2% |
| Immigrants | Africa | 2.1 /100 | #222 | Tragic 12.2% |
| Immigrants | Micronesia | 2.1 /100 | #223 | Tragic 12.2% |
| Immigrants | Nigeria | 1.6 /100 | #224 | Tragic 12.3% |
| Osage | 1.5 /100 | #225 | Tragic 12.3% |
| Nigerians | 1.4 /100 | #226 | Tragic 12.3% |
| Alaska Natives | 1.4 /100 | #227 | Tragic 12.4% |
| Alsatians | 1.3 /100 | #228 | Tragic 12.4% |
| Cubans | 1.3 /100 | #229 | Tragic 12.4% |
| Marshallese | 0.8 /100 | #230 | Tragic 12.5% |
| Salvadorans | 0.6 /100 | #231 | Tragic 12.6% |
Demographics Similar to Immigrants from Ireland by Male Poverty
In terms of male poverty, the demographic groups most similar to Immigrants from Ireland are Assyrian/Chaldean/Syriac (9.1%, a difference of 0.080%), Filipino (9.2%, a difference of 0.67%), Maltese (9.1%, a difference of 0.75%), Immigrants from South Central Asia (9.3%, a difference of 1.5%), and Bulgarian (9.3%, a difference of 2.0%).
| Demographics | Rating | Rank | Male Poverty |
| Immigrants | India | 100.0 /100 | #1 | Exceptional 8.2% |
| Chinese | 100.0 /100 | #2 | Exceptional 8.7% |
| Thais | 100.0 /100 | #3 | Exceptional 8.7% |
| Immigrants | Taiwan | 100.0 /100 | #4 | Exceptional 8.9% |
| Maltese | 100.0 /100 | #5 | Exceptional 9.1% |
| Assyrians/Chaldeans/Syriacs | 99.9 /100 | #6 | Exceptional 9.1% |
| Immigrants | Ireland | 99.9 /100 | #7 | Exceptional 9.1% |
| Filipinos | 99.9 /100 | #8 | Exceptional 9.2% |
| Immigrants | South Central Asia | 99.9 /100 | #9 | Exceptional 9.3% |
| Bulgarians | 99.9 /100 | #10 | Exceptional 9.3% |
| Bolivians | 99.9 /100 | #11 | Exceptional 9.4% |
| Immigrants | Bolivia | 99.9 /100 | #12 | Exceptional 9.4% |
| Immigrants | Lithuania | 99.9 /100 | #13 | Exceptional 9.4% |
| Immigrants | North Macedonia | 99.8 /100 | #14 | Exceptional 9.4% |
| Bhutanese | 99.8 /100 | #15 | Exceptional 9.5% |