Immigrants from Morocco vs Immigrants from Chile Householder Income Ages 25 - 44 years
COMPARE
Immigrants from Morocco
Immigrants from Chile
Householder Income Ages 25 - 44 years
Householder Income Ages 25 - 44 years Comparison
Immigrants from Morocco
Immigrants from Chile
$97,305
HOUSEHOLDER INCOME AGES 25 - 44 YEARS
82.0/ 100
METRIC RATING
140th/ 347
METRIC RANK
$97,159
HOUSEHOLDER INCOME AGES 25 - 44 YEARS
80.8/ 100
METRIC RATING
144th/ 347
METRIC RANK
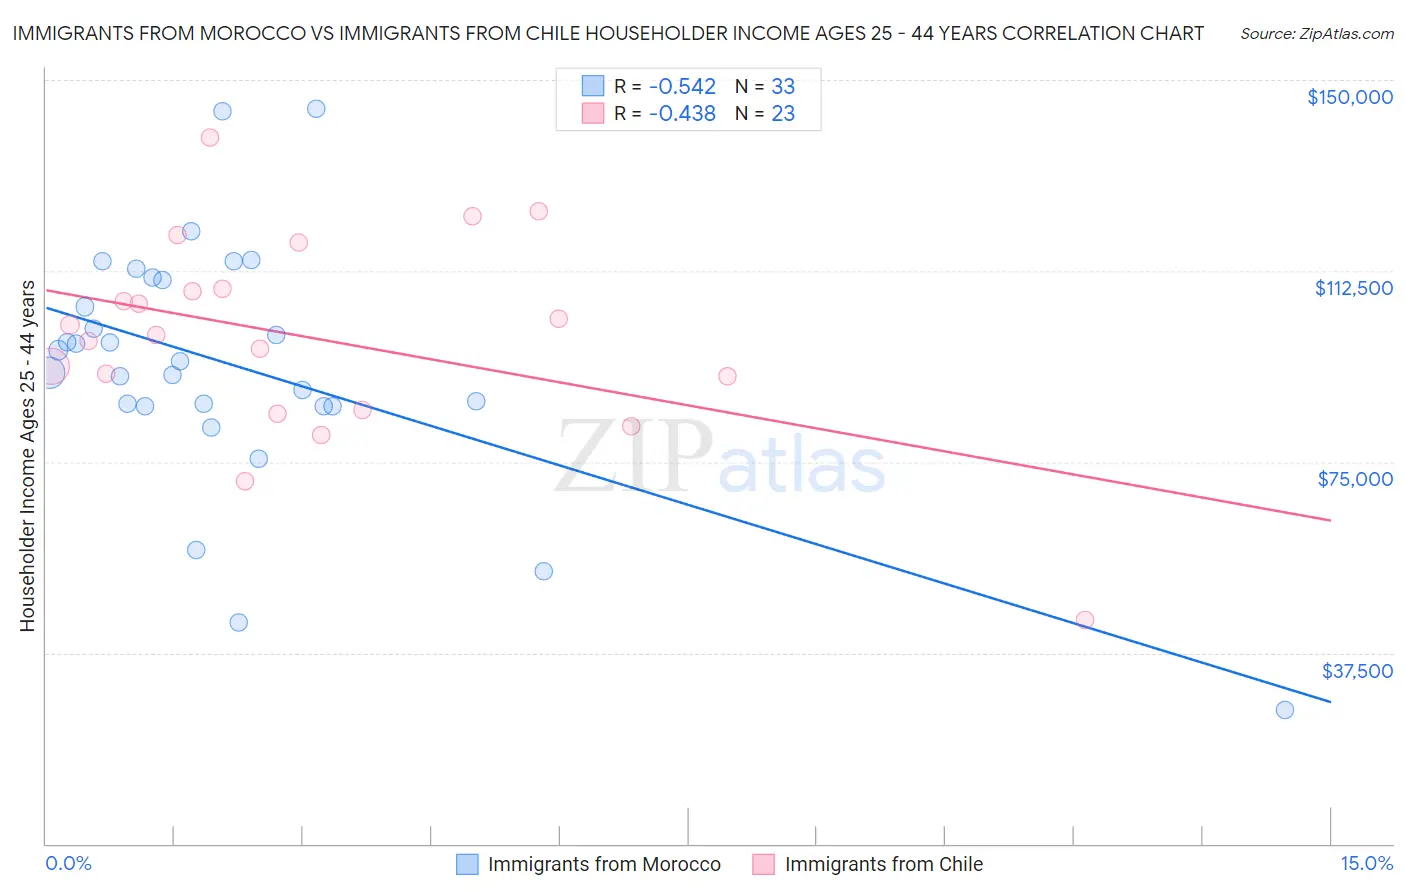
Immigrants from Morocco vs Immigrants from Chile Householder Income Ages 25 - 44 years Correlation Chart
The statistical analysis conducted on geographies consisting of 178,797,729 people shows a substantial negative correlation between the proportion of Immigrants from Morocco and household income with householder between the ages 25 and 44 in the United States with a correlation coefficient (R) of -0.542 and weighted average of $97,305. Similarly, the statistical analysis conducted on geographies consisting of 218,505,323 people shows a moderate negative correlation between the proportion of Immigrants from Chile and household income with householder between the ages 25 and 44 in the United States with a correlation coefficient (R) of -0.438 and weighted average of $97,159, a difference of 0.15%.
Householder Income Ages 25 - 44 years Correlation Summary
| Measurement | Immigrants from Morocco | Immigrants from Chile |
| Minimum | $26,250 | $43,889 |
| Maximum | $144,345 | $138,706 |
| Range | $118,095 | $94,817 |
| Mean | $93,983 | $99,118 |
| Median | $94,739 | $99,927 |
| Interquartile 25% (IQ1) | $85,878 | $85,105 |
| Interquartile 75% (IQ3) | $111,008 | $109,064 |
| Interquartile Range (IQR) | $25,131 | $23,959 |
| Standard Deviation (Sample) | $24,483 | $20,106 |
| Standard Deviation (Population) | $24,109 | $19,664 |
Demographics Similar to Immigrants from Morocco and Immigrants from Chile by Householder Income Ages 25 - 44 years
In terms of householder income ages 25 - 44 years, the demographic groups most similar to Immigrants from Morocco are Immigrants from Peru ($97,329, a difference of 0.020%), Lebanese ($97,339, a difference of 0.030%), Arab ($97,336, a difference of 0.030%), Luxembourger ($97,237, a difference of 0.070%), and Danish ($97,221, a difference of 0.090%). Similarly, the demographic groups most similar to Immigrants from Chile are Immigrants from Jordan ($97,185, a difference of 0.030%), Danish ($97,221, a difference of 0.060%), Luxembourger ($97,237, a difference of 0.080%), Arab ($97,336, a difference of 0.18%), and Immigrants from Peru ($97,329, a difference of 0.18%).
| Demographics | Rating | Rank | Householder Income Ages 25 - 44 years |
| Immigrants | Zimbabwe | 86.3 /100 | #132 | Excellent $97,880 |
| Tsimshian | 85.8 /100 | #133 | Excellent $97,809 |
| Canadians | 84.5 /100 | #134 | Excellent $97,625 |
| Immigrants | Oceania | 84.5 /100 | #135 | Excellent $97,623 |
| Hungarians | 83.9 /100 | #136 | Excellent $97,544 |
| Lebanese | 82.3 /100 | #137 | Excellent $97,339 |
| Arabs | 82.3 /100 | #138 | Excellent $97,336 |
| Immigrants | Peru | 82.2 /100 | #139 | Excellent $97,329 |
| Immigrants | Morocco | 82.0 /100 | #140 | Excellent $97,305 |
| Luxembourgers | 81.5 /100 | #141 | Excellent $97,237 |
| Danes | 81.3 /100 | #142 | Excellent $97,221 |
| Immigrants | Jordan | 81.0 /100 | #143 | Excellent $97,185 |
| Immigrants | Chile | 80.8 /100 | #144 | Excellent $97,159 |
| Norwegians | 78.2 /100 | #145 | Good $96,866 |
| Ethiopians | 77.8 /100 | #146 | Good $96,824 |
| Immigrants | Syria | 77.4 /100 | #147 | Good $96,789 |
| Irish | 76.9 /100 | #148 | Good $96,730 |
| Basques | 76.6 /100 | #149 | Good $96,709 |
| Ugandans | 76.2 /100 | #150 | Good $96,667 |
| Czechs | 74.8 /100 | #151 | Good $96,525 |
| South American Indians | 74.5 /100 | #152 | Good $96,497 |