Immigrants from Morocco vs Immigrants from Northern Africa Poverty
COMPARE
Immigrants from Morocco
Immigrants from Northern Africa
Poverty
Poverty Comparison
Immigrants from Morocco
Immigrants from Northern Africa
12.4%
POVERTY
44.0/ 100
METRIC RATING
179th/ 347
METRIC RANK
12.1%
POVERTY
63.9/ 100
METRIC RATING
153rd/ 347
METRIC RANK
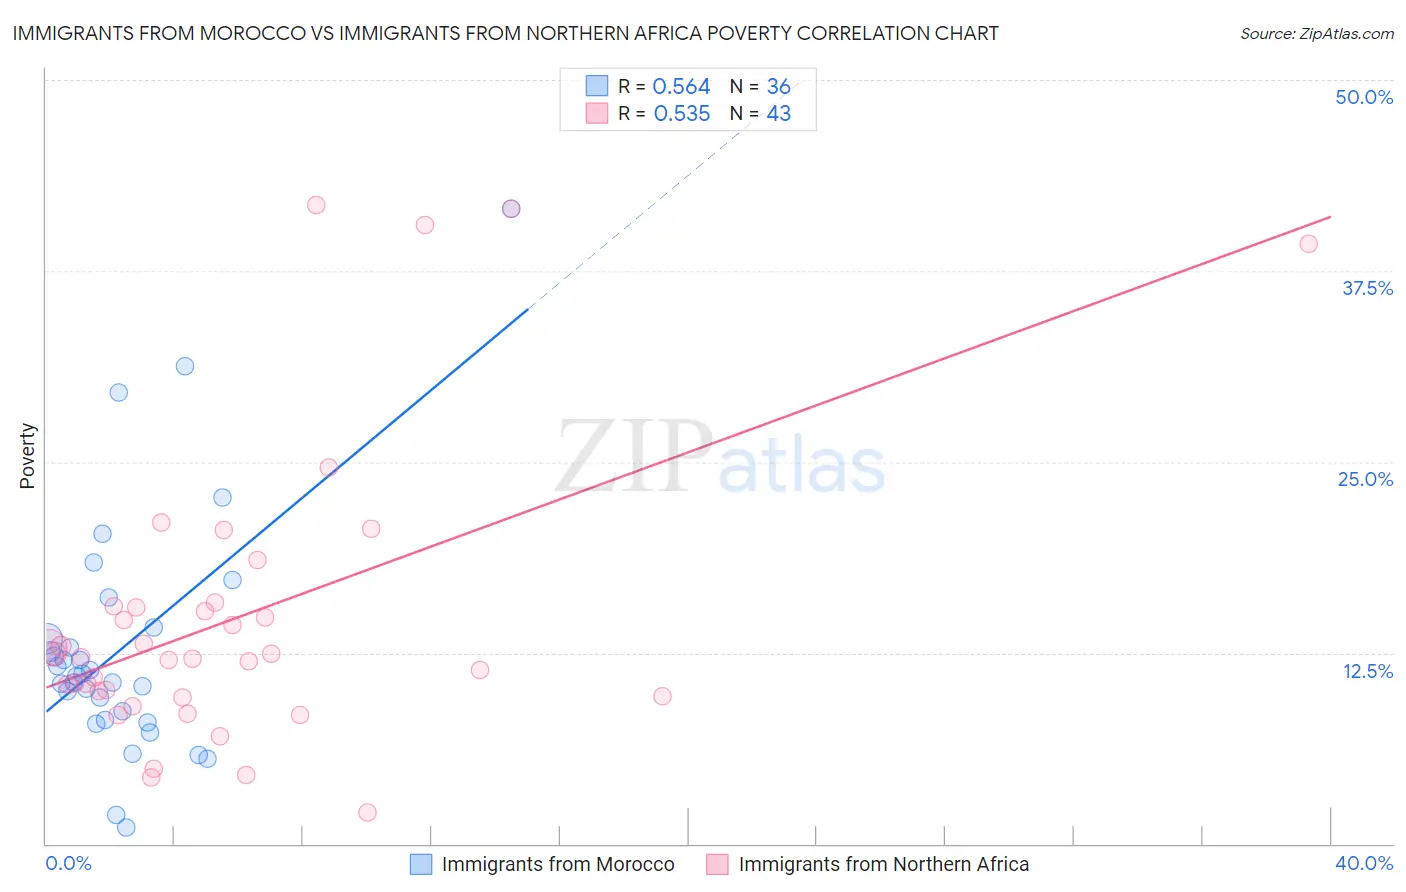
Immigrants from Morocco vs Immigrants from Northern Africa Poverty Correlation Chart
The statistical analysis conducted on geographies consisting of 178,904,952 people shows a substantial positive correlation between the proportion of Immigrants from Morocco and poverty level in the United States with a correlation coefficient (R) of 0.564 and weighted average of 12.4%. Similarly, the statistical analysis conducted on geographies consisting of 321,083,252 people shows a substantial positive correlation between the proportion of Immigrants from Northern Africa and poverty level in the United States with a correlation coefficient (R) of 0.535 and weighted average of 12.1%, a difference of 2.0%.
Poverty Correlation Summary
| Measurement | Immigrants from Morocco | Immigrants from Northern Africa |
| Minimum | 1.1% | 2.1% |
| Maximum | 41.6% | 41.8% |
| Range | 40.5% | 39.7% |
| Mean | 12.9% | 14.8% |
| Median | 11.1% | 12.2% |
| Interquartile 25% (IQ1) | 8.4% | 9.7% |
| Interquartile 75% (IQ3) | 13.8% | 15.6% |
| Interquartile Range (IQR) | 5.4% | 5.9% |
| Standard Deviation (Sample) | 8.0% | 9.6% |
| Standard Deviation (Population) | 7.9% | 9.5% |
Similar Demographics by Poverty
Demographics Similar to Immigrants from Morocco by Poverty
In terms of poverty, the demographic groups most similar to Immigrants from Morocco are Mongolian (12.4%, a difference of 0.040%), Uruguayan (12.4%, a difference of 0.060%), Immigrants from Afghanistan (12.4%, a difference of 0.19%), Immigrants from Cameroon (12.4%, a difference of 0.23%), and Immigrants from Syria (12.3%, a difference of 0.33%).
| Demographics | Rating | Rank | Poverty |
| Immigrants | Portugal | 50.5 /100 | #172 | Average 12.3% |
| Celtics | 50.1 /100 | #173 | Average 12.3% |
| Lebanese | 50.0 /100 | #174 | Average 12.3% |
| South Americans | 48.7 /100 | #175 | Average 12.3% |
| Immigrants | Colombia | 47.7 /100 | #176 | Average 12.3% |
| Immigrants | Syria | 47.5 /100 | #177 | Average 12.3% |
| Uruguayans | 44.7 /100 | #178 | Average 12.4% |
| Immigrants | Morocco | 44.0 /100 | #179 | Average 12.4% |
| Mongolians | 43.6 /100 | #180 | Average 12.4% |
| Immigrants | Afghanistan | 42.1 /100 | #181 | Average 12.4% |
| Immigrants | Cameroon | 41.7 /100 | #182 | Average 12.4% |
| Immigrants | Iraq | 40.2 /100 | #183 | Average 12.4% |
| Kenyans | 38.8 /100 | #184 | Fair 12.5% |
| Israelis | 36.4 /100 | #185 | Fair 12.5% |
| Immigrants | Sierra Leone | 36.3 /100 | #186 | Fair 12.5% |
Demographics Similar to Immigrants from Northern Africa by Poverty
In terms of poverty, the demographic groups most similar to Immigrants from Northern Africa are Guamanian/Chamorro (12.1%, a difference of 0.010%), Hungarian (12.2%, a difference of 0.030%), Scotch-Irish (12.2%, a difference of 0.15%), Costa Rican (12.2%, a difference of 0.18%), and Taiwanese (12.2%, a difference of 0.22%).
| Demographics | Rating | Rank | Poverty |
| Afghans | 74.9 /100 | #146 | Good 12.0% |
| Immigrants | Bosnia and Herzegovina | 73.7 /100 | #147 | Good 12.0% |
| Immigrants | Germany | 72.7 /100 | #148 | Good 12.0% |
| Immigrants | Malaysia | 72.7 /100 | #149 | Good 12.0% |
| Immigrants | Kazakhstan | 72.3 /100 | #150 | Good 12.0% |
| Samoans | 71.9 /100 | #151 | Good 12.0% |
| Armenians | 67.6 /100 | #152 | Good 12.1% |
| Immigrants | Northern Africa | 63.9 /100 | #153 | Good 12.1% |
| Guamanians/Chamorros | 63.9 /100 | #154 | Good 12.1% |
| Hungarians | 63.6 /100 | #155 | Good 12.2% |
| Scotch-Irish | 62.6 /100 | #156 | Good 12.2% |
| Costa Ricans | 62.2 /100 | #157 | Good 12.2% |
| Taiwanese | 61.8 /100 | #158 | Good 12.2% |
| Pennsylvania Germans | 60.8 /100 | #159 | Good 12.2% |
| Immigrants | Nepal | 60.4 /100 | #160 | Good 12.2% |