Immigrants from Morocco vs Marshallese Poverty
COMPARE
Immigrants from Morocco
Marshallese
Poverty
Poverty Comparison
Immigrants from Morocco
Marshallese
12.4%
POVERTY
44.0/ 100
METRIC RATING
179th/ 347
METRIC RANK
13.4%
POVERTY
2.2/ 100
METRIC RATING
226th/ 347
METRIC RANK
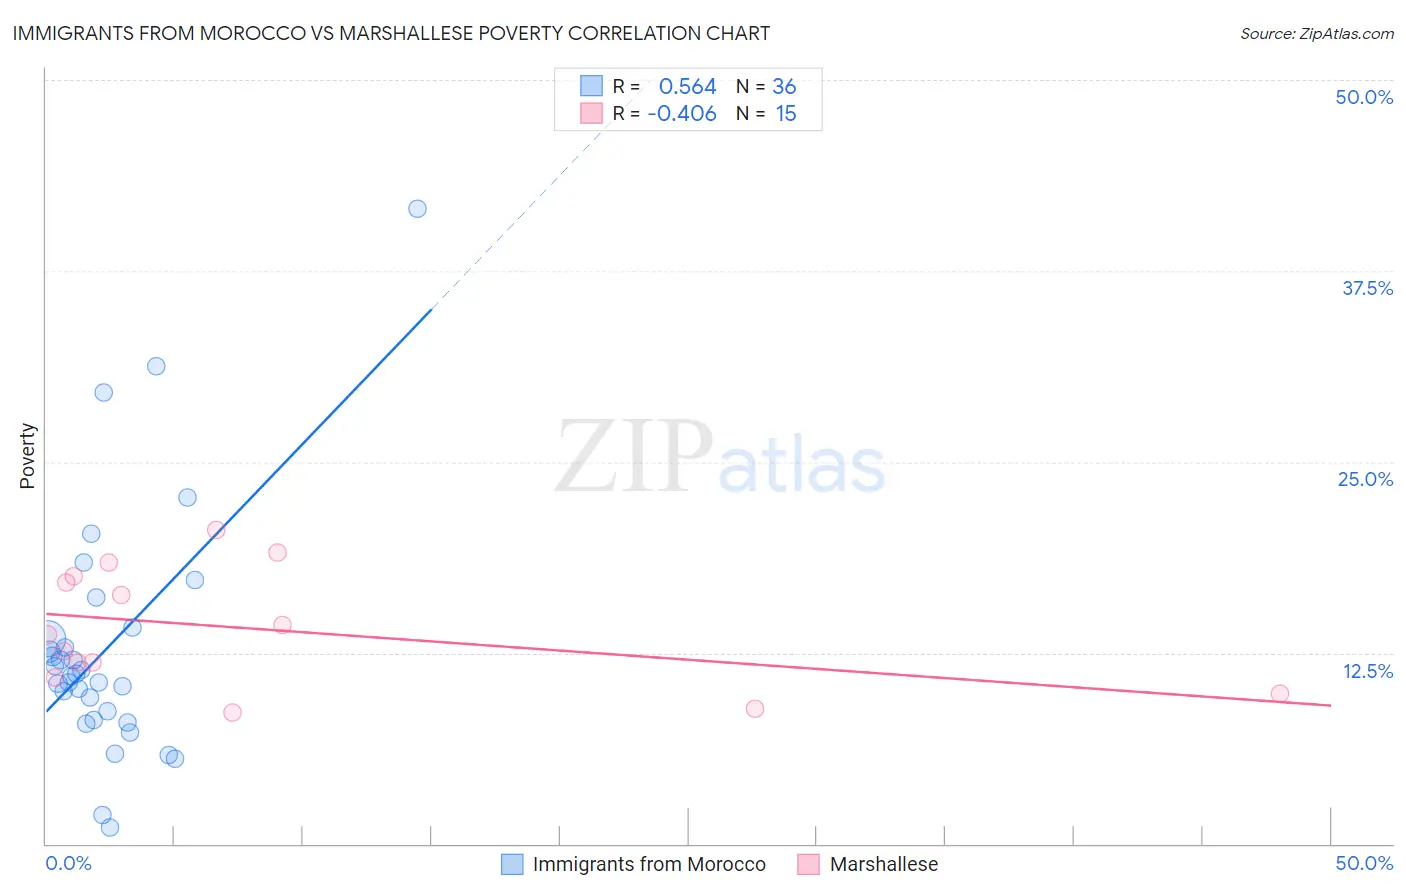
Immigrants from Morocco vs Marshallese Poverty Correlation Chart
The statistical analysis conducted on geographies consisting of 178,904,952 people shows a substantial positive correlation between the proportion of Immigrants from Morocco and poverty level in the United States with a correlation coefficient (R) of 0.564 and weighted average of 12.4%. Similarly, the statistical analysis conducted on geographies consisting of 14,760,991 people shows a moderate negative correlation between the proportion of Marshallese and poverty level in the United States with a correlation coefficient (R) of -0.406 and weighted average of 13.4%, a difference of 8.6%.
Poverty Correlation Summary
| Measurement | Immigrants from Morocco | Marshallese |
| Minimum | 1.1% | 8.6% |
| Maximum | 41.6% | 20.5% |
| Range | 40.5% | 12.0% |
| Mean | 12.9% | 14.1% |
| Median | 11.1% | 13.7% |
| Interquartile 25% (IQ1) | 8.4% | 10.9% |
| Interquartile 75% (IQ3) | 13.8% | 17.5% |
| Interquartile Range (IQR) | 5.4% | 6.6% |
| Standard Deviation (Sample) | 8.0% | 3.9% |
| Standard Deviation (Population) | 7.9% | 3.7% |
Similar Demographics by Poverty
Demographics Similar to Immigrants from Morocco by Poverty
In terms of poverty, the demographic groups most similar to Immigrants from Morocco are Mongolian (12.4%, a difference of 0.040%), Uruguayan (12.4%, a difference of 0.060%), Immigrants from Afghanistan (12.4%, a difference of 0.19%), Immigrants from Cameroon (12.4%, a difference of 0.23%), and Immigrants from Syria (12.3%, a difference of 0.33%).
| Demographics | Rating | Rank | Poverty |
| Immigrants | Portugal | 50.5 /100 | #172 | Average 12.3% |
| Celtics | 50.1 /100 | #173 | Average 12.3% |
| Lebanese | 50.0 /100 | #174 | Average 12.3% |
| South Americans | 48.7 /100 | #175 | Average 12.3% |
| Immigrants | Colombia | 47.7 /100 | #176 | Average 12.3% |
| Immigrants | Syria | 47.5 /100 | #177 | Average 12.3% |
| Uruguayans | 44.7 /100 | #178 | Average 12.4% |
| Immigrants | Morocco | 44.0 /100 | #179 | Average 12.4% |
| Mongolians | 43.6 /100 | #180 | Average 12.4% |
| Immigrants | Afghanistan | 42.1 /100 | #181 | Average 12.4% |
| Immigrants | Cameroon | 41.7 /100 | #182 | Average 12.4% |
| Immigrants | Iraq | 40.2 /100 | #183 | Average 12.4% |
| Kenyans | 38.8 /100 | #184 | Fair 12.5% |
| Israelis | 36.4 /100 | #185 | Fair 12.5% |
| Immigrants | Sierra Leone | 36.3 /100 | #186 | Fair 12.5% |
Demographics Similar to Marshallese by Poverty
In terms of poverty, the demographic groups most similar to Marshallese are German Russian (13.4%, a difference of 0.010%), Alaska Native (13.5%, a difference of 0.15%), Immigrants from Eritrea (13.4%, a difference of 0.23%), Immigrants from Africa (13.4%, a difference of 0.33%), and Immigrants from Micronesia (13.4%, a difference of 0.36%).
| Demographics | Rating | Rank | Poverty |
| Immigrants | Cambodia | 3.0 /100 | #219 | Tragic 13.4% |
| Americans | 2.9 /100 | #220 | Tragic 13.4% |
| Alsatians | 2.6 /100 | #221 | Tragic 13.4% |
| Immigrants | Micronesia | 2.6 /100 | #222 | Tragic 13.4% |
| Immigrants | Africa | 2.5 /100 | #223 | Tragic 13.4% |
| Immigrants | Eritrea | 2.4 /100 | #224 | Tragic 13.4% |
| German Russians | 2.2 /100 | #225 | Tragic 13.4% |
| Marshallese | 2.2 /100 | #226 | Tragic 13.4% |
| Alaska Natives | 2.1 /100 | #227 | Tragic 13.5% |
| Immigrants | Nigeria | 1.7 /100 | #228 | Tragic 13.5% |
| Osage | 1.5 /100 | #229 | Tragic 13.6% |
| Alaskan Athabascans | 1.5 /100 | #230 | Tragic 13.6% |
| Nigerians | 1.4 /100 | #231 | Tragic 13.6% |
| Fijians | 0.8 /100 | #232 | Tragic 13.7% |
| Immigrants | Saudi Arabia | 0.8 /100 | #233 | Tragic 13.8% |