Immigrants from Morocco vs Trinidadian and Tobagonian Poverty
COMPARE
Immigrants from Morocco
Trinidadian and Tobagonian
Poverty
Poverty Comparison
Immigrants from Morocco
Trinidadians and Tobagonians
12.4%
POVERTY
44.0/ 100
METRIC RATING
179th/ 347
METRIC RANK
14.3%
POVERTY
0.1/ 100
METRIC RATING
257th/ 347
METRIC RANK
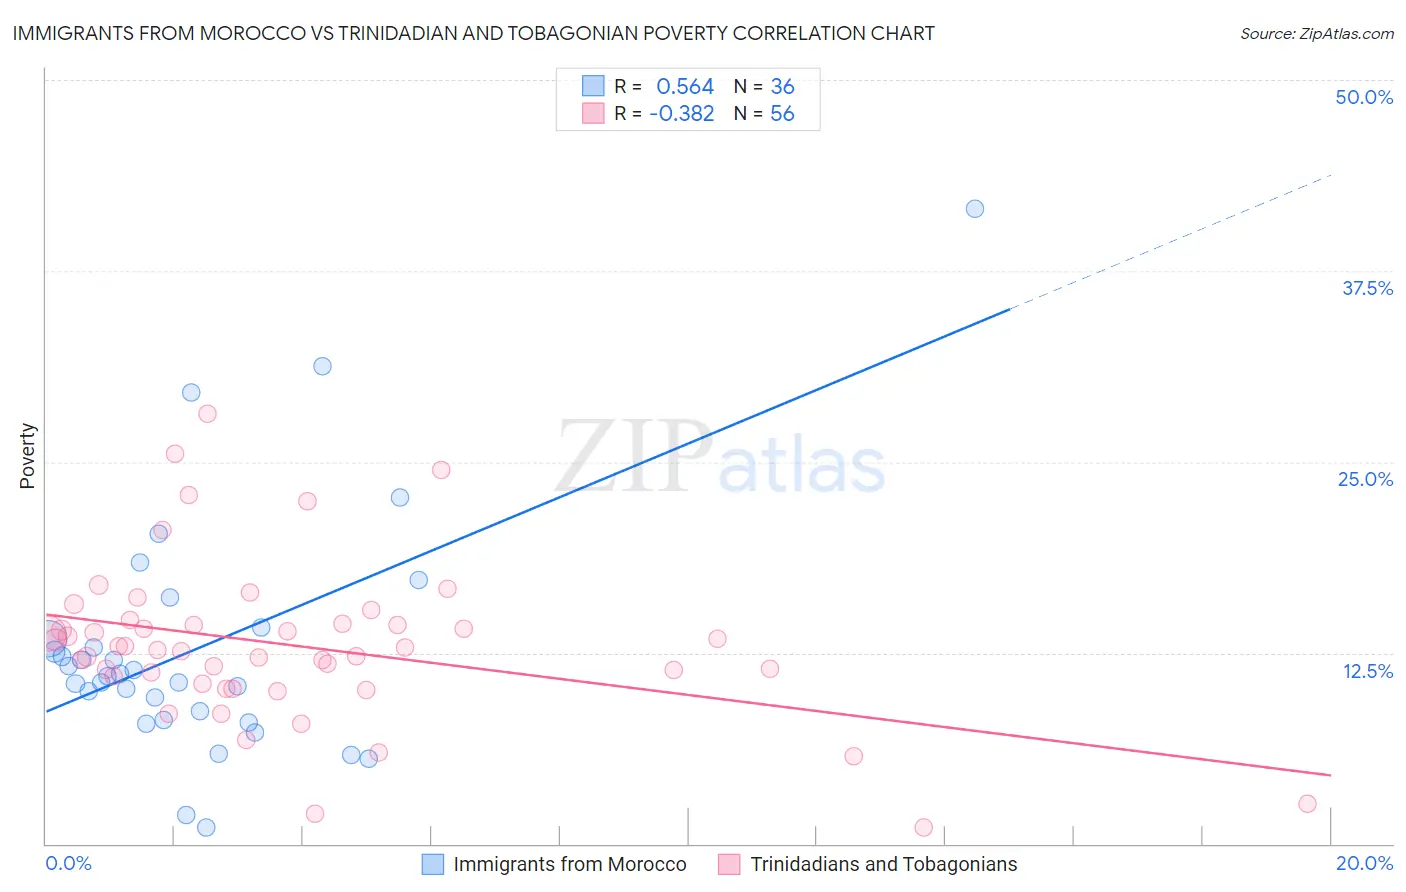
Immigrants from Morocco vs Trinidadian and Tobagonian Poverty Correlation Chart
The statistical analysis conducted on geographies consisting of 178,904,952 people shows a substantial positive correlation between the proportion of Immigrants from Morocco and poverty level in the United States with a correlation coefficient (R) of 0.564 and weighted average of 12.4%. Similarly, the statistical analysis conducted on geographies consisting of 219,718,536 people shows a mild negative correlation between the proportion of Trinidadians and Tobagonians and poverty level in the United States with a correlation coefficient (R) of -0.382 and weighted average of 14.3%, a difference of 15.4%.
Poverty Correlation Summary
| Measurement | Immigrants from Morocco | Trinidadian and Tobagonian |
| Minimum | 1.1% | 1.0% |
| Maximum | 41.6% | 28.1% |
| Range | 40.5% | 27.1% |
| Mean | 12.9% | 13.0% |
| Median | 11.1% | 12.8% |
| Interquartile 25% (IQ1) | 8.4% | 10.7% |
| Interquartile 75% (IQ3) | 13.8% | 14.4% |
| Interquartile Range (IQR) | 5.4% | 3.7% |
| Standard Deviation (Sample) | 8.0% | 5.2% |
| Standard Deviation (Population) | 7.9% | 5.1% |
Similar Demographics by Poverty
Demographics Similar to Immigrants from Morocco by Poverty
In terms of poverty, the demographic groups most similar to Immigrants from Morocco are Mongolian (12.4%, a difference of 0.040%), Uruguayan (12.4%, a difference of 0.060%), Immigrants from Afghanistan (12.4%, a difference of 0.19%), Immigrants from Cameroon (12.4%, a difference of 0.23%), and Immigrants from Syria (12.3%, a difference of 0.33%).
| Demographics | Rating | Rank | Poverty |
| Immigrants | Portugal | 50.5 /100 | #172 | Average 12.3% |
| Celtics | 50.1 /100 | #173 | Average 12.3% |
| Lebanese | 50.0 /100 | #174 | Average 12.3% |
| South Americans | 48.7 /100 | #175 | Average 12.3% |
| Immigrants | Colombia | 47.7 /100 | #176 | Average 12.3% |
| Immigrants | Syria | 47.5 /100 | #177 | Average 12.3% |
| Uruguayans | 44.7 /100 | #178 | Average 12.4% |
| Immigrants | Morocco | 44.0 /100 | #179 | Average 12.4% |
| Mongolians | 43.6 /100 | #180 | Average 12.4% |
| Immigrants | Afghanistan | 42.1 /100 | #181 | Average 12.4% |
| Immigrants | Cameroon | 41.7 /100 | #182 | Average 12.4% |
| Immigrants | Iraq | 40.2 /100 | #183 | Average 12.4% |
| Kenyans | 38.8 /100 | #184 | Fair 12.5% |
| Israelis | 36.4 /100 | #185 | Fair 12.5% |
| Immigrants | Sierra Leone | 36.3 /100 | #186 | Fair 12.5% |
Demographics Similar to Trinidadians and Tobagonians by Poverty
In terms of poverty, the demographic groups most similar to Trinidadians and Tobagonians are Ottawa (14.3%, a difference of 0.010%), Mexican American Indian (14.3%, a difference of 0.040%), Immigrants from Ecuador (14.3%, a difference of 0.060%), Immigrants from El Salvador (14.3%, a difference of 0.16%), and Immigrants from Nicaragua (14.3%, a difference of 0.28%).
| Demographics | Rating | Rank | Poverty |
| Cree | 0.2 /100 | #250 | Tragic 14.2% |
| Immigrants | Burma/Myanmar | 0.2 /100 | #251 | Tragic 14.2% |
| Spanish American Indians | 0.2 /100 | #252 | Tragic 14.2% |
| Immigrants | Trinidad and Tobago | 0.2 /100 | #253 | Tragic 14.2% |
| Immigrants | El Salvador | 0.1 /100 | #254 | Tragic 14.3% |
| Immigrants | Ecuador | 0.1 /100 | #255 | Tragic 14.3% |
| Mexican American Indians | 0.1 /100 | #256 | Tragic 14.3% |
| Trinidadians and Tobagonians | 0.1 /100 | #257 | Tragic 14.3% |
| Ottawa | 0.1 /100 | #258 | Tragic 14.3% |
| Immigrants | Nicaragua | 0.1 /100 | #259 | Tragic 14.3% |
| Cape Verdeans | 0.1 /100 | #260 | Tragic 14.4% |
| Cherokee | 0.1 /100 | #261 | Tragic 14.4% |
| Immigrants | Liberia | 0.1 /100 | #262 | Tragic 14.4% |
| Jamaicans | 0.1 /100 | #263 | Tragic 14.4% |
| Immigrants | Jamaica | 0.1 /100 | #264 | Tragic 14.4% |