Immigrants from Morocco vs Immigrants from Chile Master's Degree
COMPARE
Immigrants from Morocco
Immigrants from Chile
Master's Degree
Master's Degree Comparison
Immigrants from Morocco
Immigrants from Chile
17.1%
MASTER'S DEGREE
98.9/ 100
METRIC RATING
95th/ 347
METRIC RANK
16.8%
MASTER'S DEGREE
98.0/ 100
METRIC RATING
110th/ 347
METRIC RANK
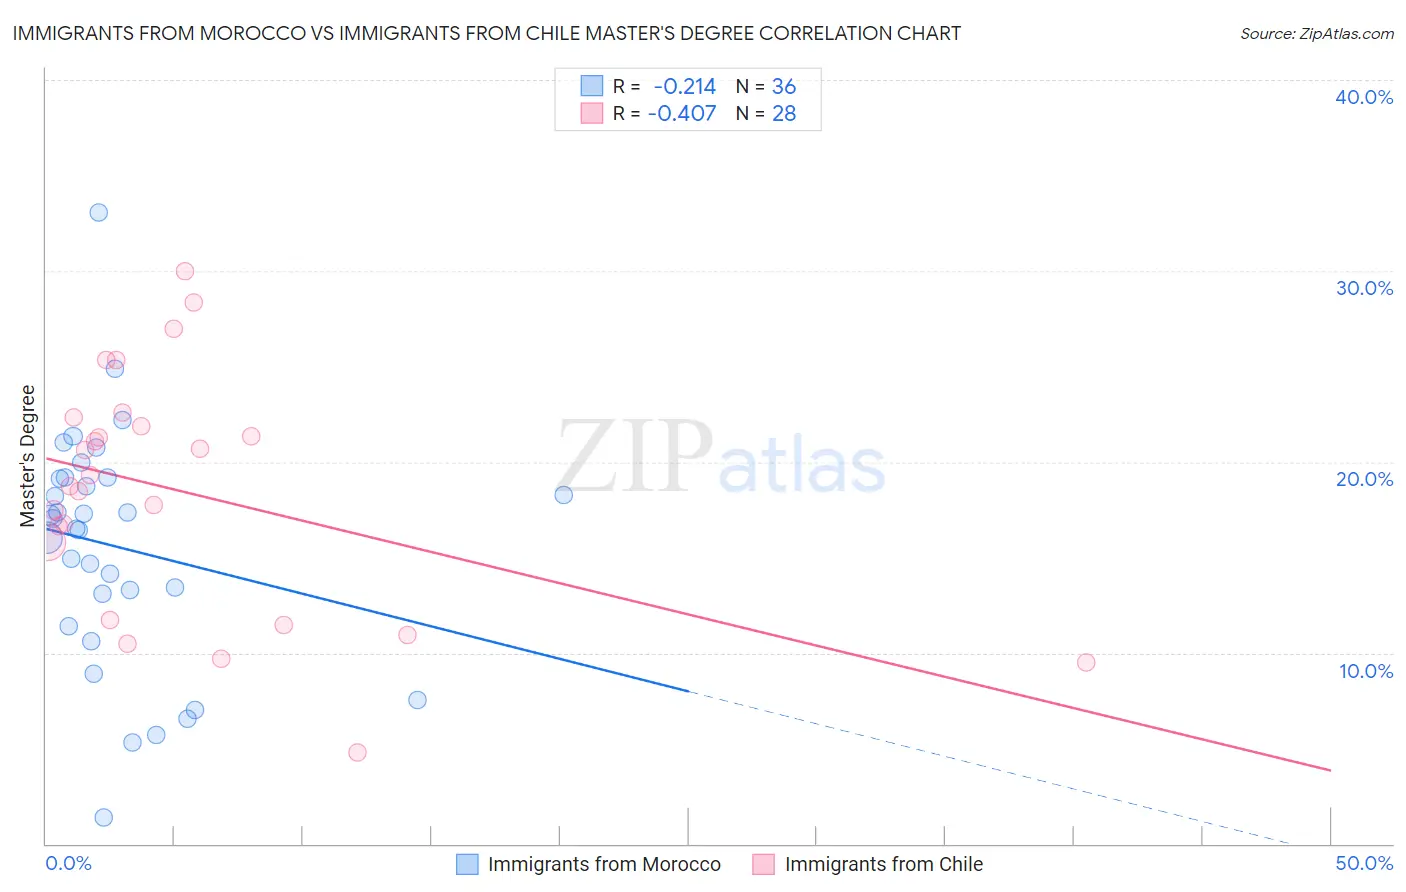
Immigrants from Morocco vs Immigrants from Chile Master's Degree Correlation Chart
The statistical analysis conducted on geographies consisting of 178,911,392 people shows a weak negative correlation between the proportion of Immigrants from Morocco and percentage of population with at least master's degree education in the United States with a correlation coefficient (R) of -0.214 and weighted average of 17.1%. Similarly, the statistical analysis conducted on geographies consisting of 218,626,244 people shows a moderate negative correlation between the proportion of Immigrants from Chile and percentage of population with at least master's degree education in the United States with a correlation coefficient (R) of -0.407 and weighted average of 16.8%, a difference of 1.8%.
Master's Degree Correlation Summary
| Measurement | Immigrants from Morocco | Immigrants from Chile |
| Minimum | 1.4% | 4.8% |
| Maximum | 33.1% | 30.0% |
| Range | 31.7% | 25.2% |
| Mean | 15.5% | 18.5% |
| Median | 16.8% | 19.0% |
| Interquartile 25% (IQ1) | 12.2% | 13.8% |
| Interquartile 75% (IQ3) | 19.1% | 22.1% |
| Interquartile Range (IQR) | 6.9% | 8.3% |
| Standard Deviation (Sample) | 6.2% | 6.2% |
| Standard Deviation (Population) | 6.1% | 6.1% |
Demographics Similar to Immigrants from Morocco and Immigrants from Chile by Master's Degree
In terms of master's degree, the demographic groups most similar to Immigrants from Morocco are Immigrants from Northern Africa (17.1%, a difference of 0.030%), Immigrants from England (17.0%, a difference of 0.19%), Immigrants from Ukraine (17.0%, a difference of 0.29%), Ugandan (17.1%, a difference of 0.32%), and Laotian (17.0%, a difference of 0.35%). Similarly, the demographic groups most similar to Immigrants from Chile are Moroccan (16.8%, a difference of 0.030%), Sierra Leonean (16.8%, a difference of 0.050%), Armenian (16.8%, a difference of 0.080%), Immigrants from Albania (16.8%, a difference of 0.17%), and Austrian (16.7%, a difference of 0.27%).
| Demographics | Rating | Rank | Master's Degree |
| Immigrants | North America | 99.1 /100 | #92 | Exceptional 17.2% |
| Immigrants | Italy | 99.1 /100 | #93 | Exceptional 17.2% |
| Ugandans | 99.0 /100 | #94 | Exceptional 17.1% |
| Immigrants | Morocco | 98.9 /100 | #95 | Exceptional 17.1% |
| Immigrants | Northern Africa | 98.9 /100 | #96 | Exceptional 17.1% |
| Immigrants | England | 98.8 /100 | #97 | Exceptional 17.0% |
| Immigrants | Ukraine | 98.8 /100 | #98 | Exceptional 17.0% |
| Laotians | 98.8 /100 | #99 | Exceptional 17.0% |
| Albanians | 98.7 /100 | #100 | Exceptional 17.0% |
| Immigrants | Nepal | 98.6 /100 | #101 | Exceptional 17.0% |
| Chileans | 98.6 /100 | #102 | Exceptional 16.9% |
| Alsatians | 98.4 /100 | #103 | Exceptional 16.9% |
| Ukrainians | 98.3 /100 | #104 | Exceptional 16.9% |
| Syrians | 98.3 /100 | #105 | Exceptional 16.8% |
| Immigrants | Albania | 98.1 /100 | #106 | Exceptional 16.8% |
| Armenians | 98.0 /100 | #107 | Exceptional 16.8% |
| Sierra Leoneans | 98.0 /100 | #108 | Exceptional 16.8% |
| Moroccans | 98.0 /100 | #109 | Exceptional 16.8% |
| Immigrants | Chile | 98.0 /100 | #110 | Exceptional 16.8% |
| Austrians | 97.8 /100 | #111 | Exceptional 16.7% |
| Macedonians | 97.7 /100 | #112 | Exceptional 16.7% |