Immigrants from Mexico vs Immigrants from Burma/Myanmar Female Poverty
COMPARE
Immigrants from Mexico
Immigrants from Burma/Myanmar
Female Poverty
Female Poverty Comparison
Immigrants from Mexico
Immigrants from Burma/Myanmar
17.0%
FEMALE POVERTY
0.0/ 100
METRIC RATING
309th/ 347
METRIC RANK
15.4%
FEMALE POVERTY
0.3/ 100
METRIC RATING
252nd/ 347
METRIC RANK
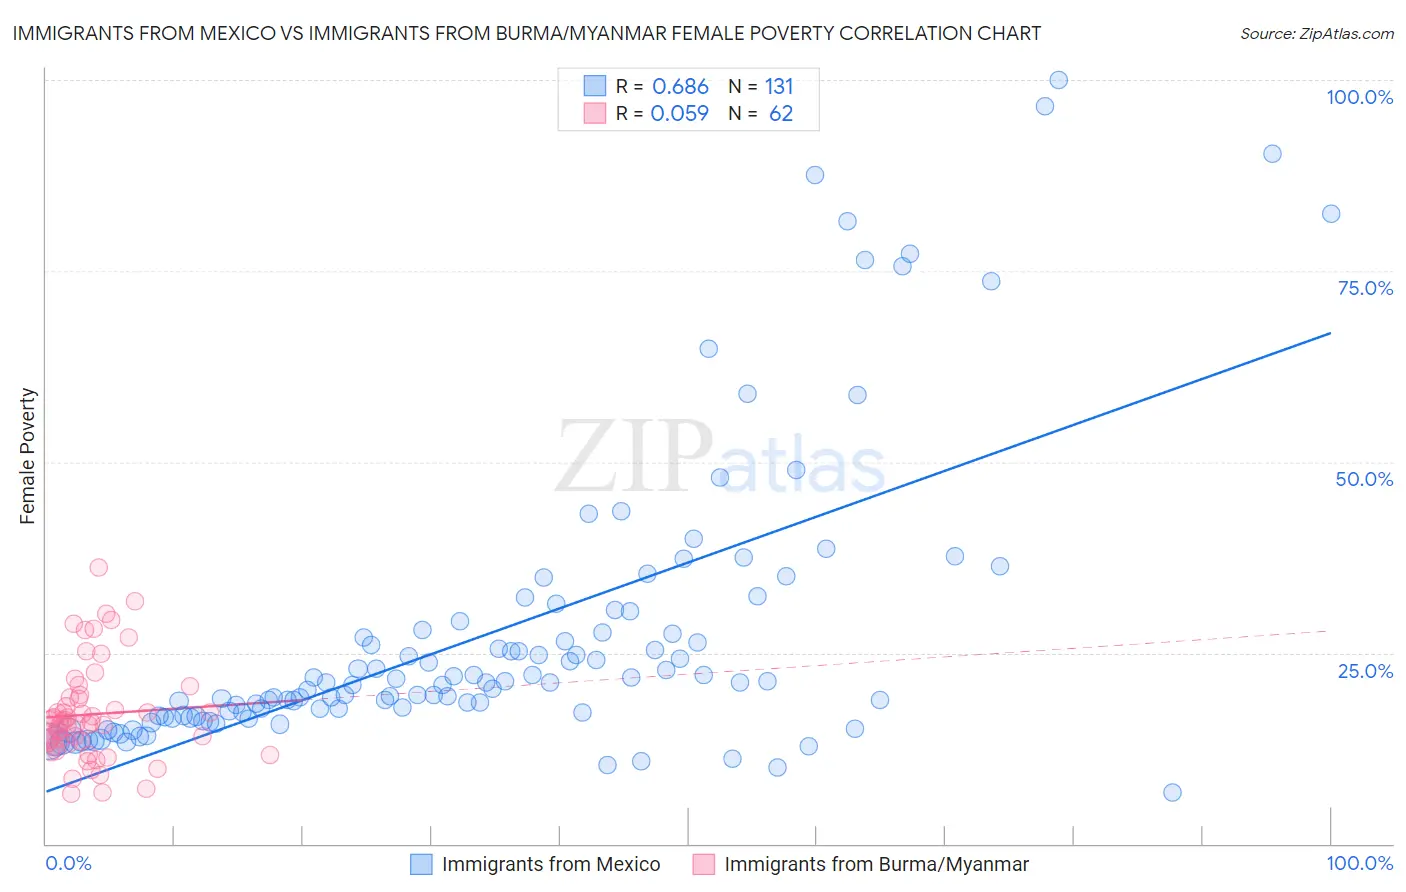
Immigrants from Mexico vs Immigrants from Burma/Myanmar Female Poverty Correlation Chart
The statistical analysis conducted on geographies consisting of 513,228,632 people shows a significant positive correlation between the proportion of Immigrants from Mexico and poverty level among females in the United States with a correlation coefficient (R) of 0.686 and weighted average of 17.0%. Similarly, the statistical analysis conducted on geographies consisting of 172,266,194 people shows a slight positive correlation between the proportion of Immigrants from Burma/Myanmar and poverty level among females in the United States with a correlation coefficient (R) of 0.059 and weighted average of 15.4%, a difference of 10.4%.
Female Poverty Correlation Summary
| Measurement | Immigrants from Mexico | Immigrants from Burma/Myanmar |
| Minimum | 6.7% | 6.5% |
| Maximum | 100.0% | 36.2% |
| Range | 93.3% | 29.7% |
| Mean | 27.4% | 17.0% |
| Median | 21.1% | 15.8% |
| Interquartile 25% (IQ1) | 16.7% | 13.2% |
| Interquartile 75% (IQ3) | 28.0% | 19.2% |
| Interquartile Range (IQR) | 11.3% | 6.1% |
| Standard Deviation (Sample) | 19.2% | 6.4% |
| Standard Deviation (Population) | 19.1% | 6.4% |
Similar Demographics by Female Poverty
Demographics Similar to Immigrants from Mexico by Female Poverty
In terms of female poverty, the demographic groups most similar to Immigrants from Mexico are Creek (17.0%, a difference of 0.24%), Immigrants from Guatemala (17.0%, a difference of 0.24%), Immigrants from Somalia (17.0%, a difference of 0.34%), African (16.9%, a difference of 0.39%), and British West Indian (17.0%, a difference of 0.41%).
| Demographics | Rating | Rank | Female Poverty |
| Chippewa | 0.0 /100 | #302 | Tragic 16.7% |
| Choctaw | 0.0 /100 | #303 | Tragic 16.8% |
| Immigrants | Central America | 0.0 /100 | #304 | Tragic 16.8% |
| Immigrants | Grenada | 0.0 /100 | #305 | Tragic 16.8% |
| Immigrants | Caribbean | 0.0 /100 | #306 | Tragic 16.9% |
| Seminole | 0.0 /100 | #307 | Tragic 16.9% |
| Africans | 0.0 /100 | #308 | Tragic 16.9% |
| Immigrants | Mexico | 0.0 /100 | #309 | Tragic 17.0% |
| Creek | 0.0 /100 | #310 | Tragic 17.0% |
| Immigrants | Guatemala | 0.0 /100 | #311 | Tragic 17.0% |
| Immigrants | Somalia | 0.0 /100 | #312 | Tragic 17.0% |
| British West Indians | 0.0 /100 | #313 | Tragic 17.0% |
| Dutch West Indians | 0.0 /100 | #314 | Tragic 17.1% |
| U.S. Virgin Islanders | 0.0 /100 | #315 | Tragic 17.3% |
| Hondurans | 0.0 /100 | #316 | Tragic 17.4% |
Demographics Similar to Immigrants from Burma/Myanmar by Female Poverty
In terms of female poverty, the demographic groups most similar to Immigrants from Burma/Myanmar are Immigrants from Trinidad and Tobago (15.4%, a difference of 0.030%), Immigrants from Western Africa (15.3%, a difference of 0.19%), Salvadoran (15.3%, a difference of 0.23%), Liberian (15.4%, a difference of 0.26%), and Immigrants from Ghana (15.3%, a difference of 0.37%).
| Demographics | Rating | Rank | Female Poverty |
| Spanish American Indians | 0.3 /100 | #245 | Tragic 15.3% |
| Cubans | 0.3 /100 | #246 | Tragic 15.3% |
| Potawatomi | 0.3 /100 | #247 | Tragic 15.3% |
| Immigrants | Ghana | 0.3 /100 | #248 | Tragic 15.3% |
| Salvadorans | 0.3 /100 | #249 | Tragic 15.3% |
| Immigrants | Western Africa | 0.3 /100 | #250 | Tragic 15.3% |
| Immigrants | Trinidad and Tobago | 0.3 /100 | #251 | Tragic 15.4% |
| Immigrants | Burma/Myanmar | 0.3 /100 | #252 | Tragic 15.4% |
| Liberians | 0.2 /100 | #253 | Tragic 15.4% |
| Trinidadians and Tobagonians | 0.2 /100 | #254 | Tragic 15.4% |
| Ottawa | 0.2 /100 | #255 | Tragic 15.5% |
| Jamaicans | 0.2 /100 | #256 | Tragic 15.5% |
| Immigrants | Jamaica | 0.1 /100 | #257 | Tragic 15.6% |
| Shoshone | 0.1 /100 | #258 | Tragic 15.6% |
| Cape Verdeans | 0.1 /100 | #259 | Tragic 15.6% |