Immigrants from Mexico vs Cheyenne Female Poverty
COMPARE
Immigrants from Mexico
Cheyenne
Female Poverty
Female Poverty Comparison
Immigrants from Mexico
Cheyenne
17.0%
FEMALE POVERTY
0.0/ 100
METRIC RATING
309th/ 347
METRIC RANK
20.2%
FEMALE POVERTY
0.0/ 100
METRIC RATING
335th/ 347
METRIC RANK
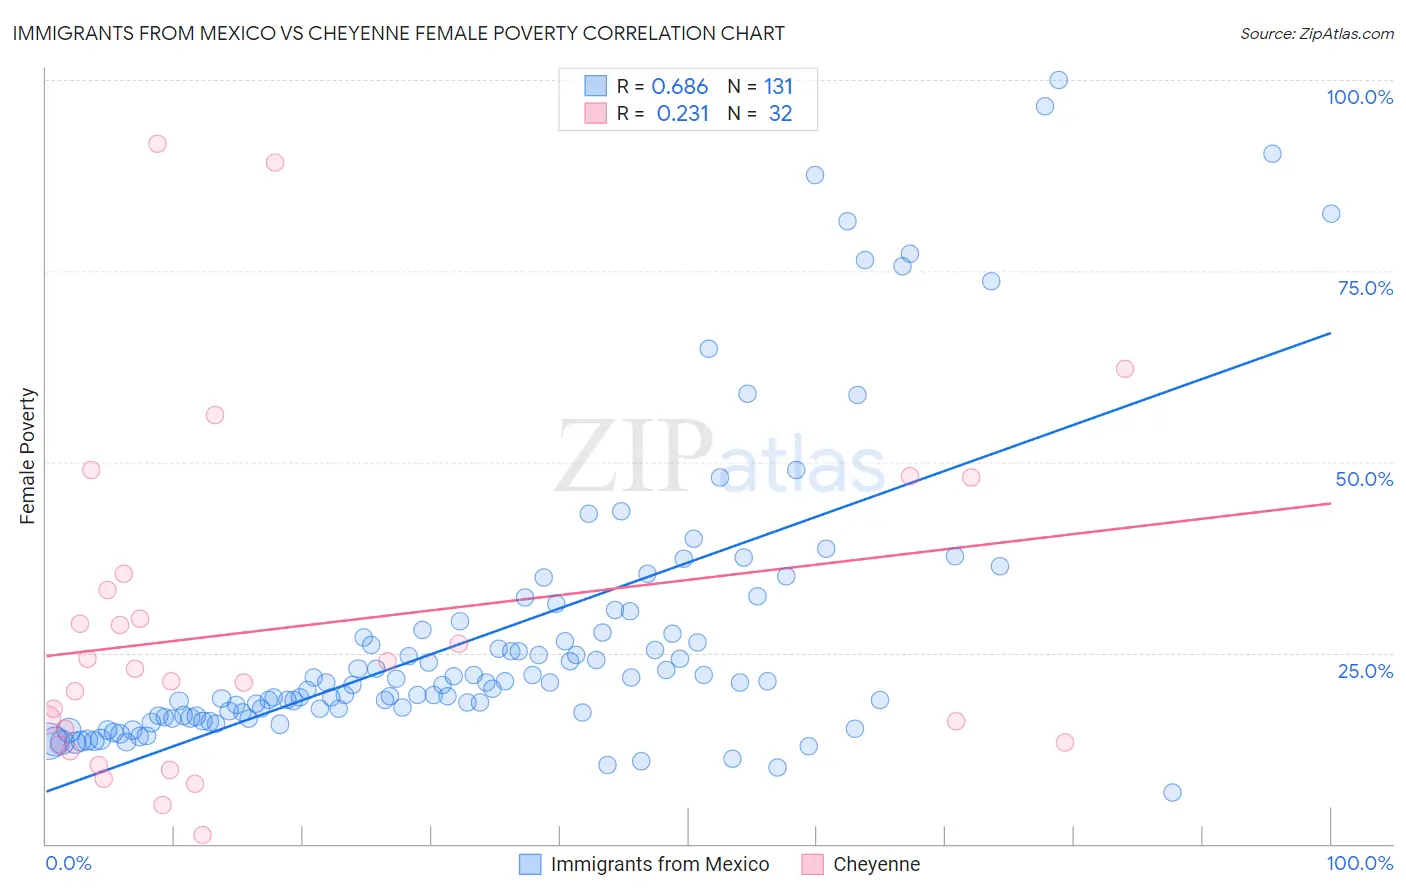
Immigrants from Mexico vs Cheyenne Female Poverty Correlation Chart
The statistical analysis conducted on geographies consisting of 513,228,632 people shows a significant positive correlation between the proportion of Immigrants from Mexico and poverty level among females in the United States with a correlation coefficient (R) of 0.686 and weighted average of 17.0%. Similarly, the statistical analysis conducted on geographies consisting of 80,704,205 people shows a weak positive correlation between the proportion of Cheyenne and poverty level among females in the United States with a correlation coefficient (R) of 0.231 and weighted average of 20.2%, a difference of 19.1%.
Female Poverty Correlation Summary
| Measurement | Immigrants from Mexico | Cheyenne |
| Minimum | 6.7% | 1.1% |
| Maximum | 100.0% | 91.7% |
| Range | 93.3% | 90.6% |
| Mean | 27.4% | 28.3% |
| Median | 21.1% | 22.0% |
| Interquartile 25% (IQ1) | 16.7% | 13.1% |
| Interquartile 75% (IQ3) | 28.0% | 34.3% |
| Interquartile Range (IQR) | 11.3% | 21.2% |
| Standard Deviation (Sample) | 19.2% | 22.2% |
| Standard Deviation (Population) | 19.1% | 21.8% |
Similar Demographics by Female Poverty
Demographics Similar to Immigrants from Mexico by Female Poverty
In terms of female poverty, the demographic groups most similar to Immigrants from Mexico are Creek (17.0%, a difference of 0.24%), Immigrants from Guatemala (17.0%, a difference of 0.24%), Immigrants from Somalia (17.0%, a difference of 0.34%), African (16.9%, a difference of 0.39%), and British West Indian (17.0%, a difference of 0.41%).
| Demographics | Rating | Rank | Female Poverty |
| Chippewa | 0.0 /100 | #302 | Tragic 16.7% |
| Choctaw | 0.0 /100 | #303 | Tragic 16.8% |
| Immigrants | Central America | 0.0 /100 | #304 | Tragic 16.8% |
| Immigrants | Grenada | 0.0 /100 | #305 | Tragic 16.8% |
| Immigrants | Caribbean | 0.0 /100 | #306 | Tragic 16.9% |
| Seminole | 0.0 /100 | #307 | Tragic 16.9% |
| Africans | 0.0 /100 | #308 | Tragic 16.9% |
| Immigrants | Mexico | 0.0 /100 | #309 | Tragic 17.0% |
| Creek | 0.0 /100 | #310 | Tragic 17.0% |
| Immigrants | Guatemala | 0.0 /100 | #311 | Tragic 17.0% |
| Immigrants | Somalia | 0.0 /100 | #312 | Tragic 17.0% |
| British West Indians | 0.0 /100 | #313 | Tragic 17.0% |
| Dutch West Indians | 0.0 /100 | #314 | Tragic 17.1% |
| U.S. Virgin Islanders | 0.0 /100 | #315 | Tragic 17.3% |
| Hondurans | 0.0 /100 | #316 | Tragic 17.4% |
Demographics Similar to Cheyenne by Female Poverty
In terms of female poverty, the demographic groups most similar to Cheyenne are Houma (20.0%, a difference of 0.77%), Pueblo (20.7%, a difference of 2.4%), Yuman (20.8%, a difference of 3.2%), Sioux (20.9%, a difference of 3.4%), and Hopi (21.0%, a difference of 3.8%).
| Demographics | Rating | Rank | Female Poverty |
| Blacks/African Americans | 0.0 /100 | #328 | Tragic 18.6% |
| Kiowa | 0.0 /100 | #329 | Tragic 18.6% |
| Dominicans | 0.0 /100 | #330 | Tragic 19.1% |
| Natives/Alaskans | 0.0 /100 | #331 | Tragic 19.2% |
| Apache | 0.0 /100 | #332 | Tragic 19.2% |
| Immigrants | Dominican Republic | 0.0 /100 | #333 | Tragic 19.3% |
| Houma | 0.0 /100 | #334 | Tragic 20.0% |
| Cheyenne | 0.0 /100 | #335 | Tragic 20.2% |
| Pueblo | 0.0 /100 | #336 | Tragic 20.7% |
| Yuman | 0.0 /100 | #337 | Tragic 20.8% |
| Sioux | 0.0 /100 | #338 | Tragic 20.9% |
| Hopi | 0.0 /100 | #339 | Tragic 21.0% |
| Yup'ik | 0.0 /100 | #340 | Tragic 21.5% |
| Crow | 0.0 /100 | #341 | Tragic 22.1% |
| Immigrants | Yemen | 0.0 /100 | #342 | Tragic 22.8% |