Immigrants from Lithuania vs West Indian Single Mother Poverty
COMPARE
Immigrants from Lithuania
West Indian
Single Mother Poverty
Single Mother Poverty Comparison
Immigrants from Lithuania
West Indians
25.2%
SINGLE MOTHER POVERTY
100.0/ 100
METRIC RATING
9th/ 347
METRIC RANK
30.8%
SINGLE MOTHER POVERTY
0.9/ 100
METRIC RATING
247th/ 347
METRIC RANK
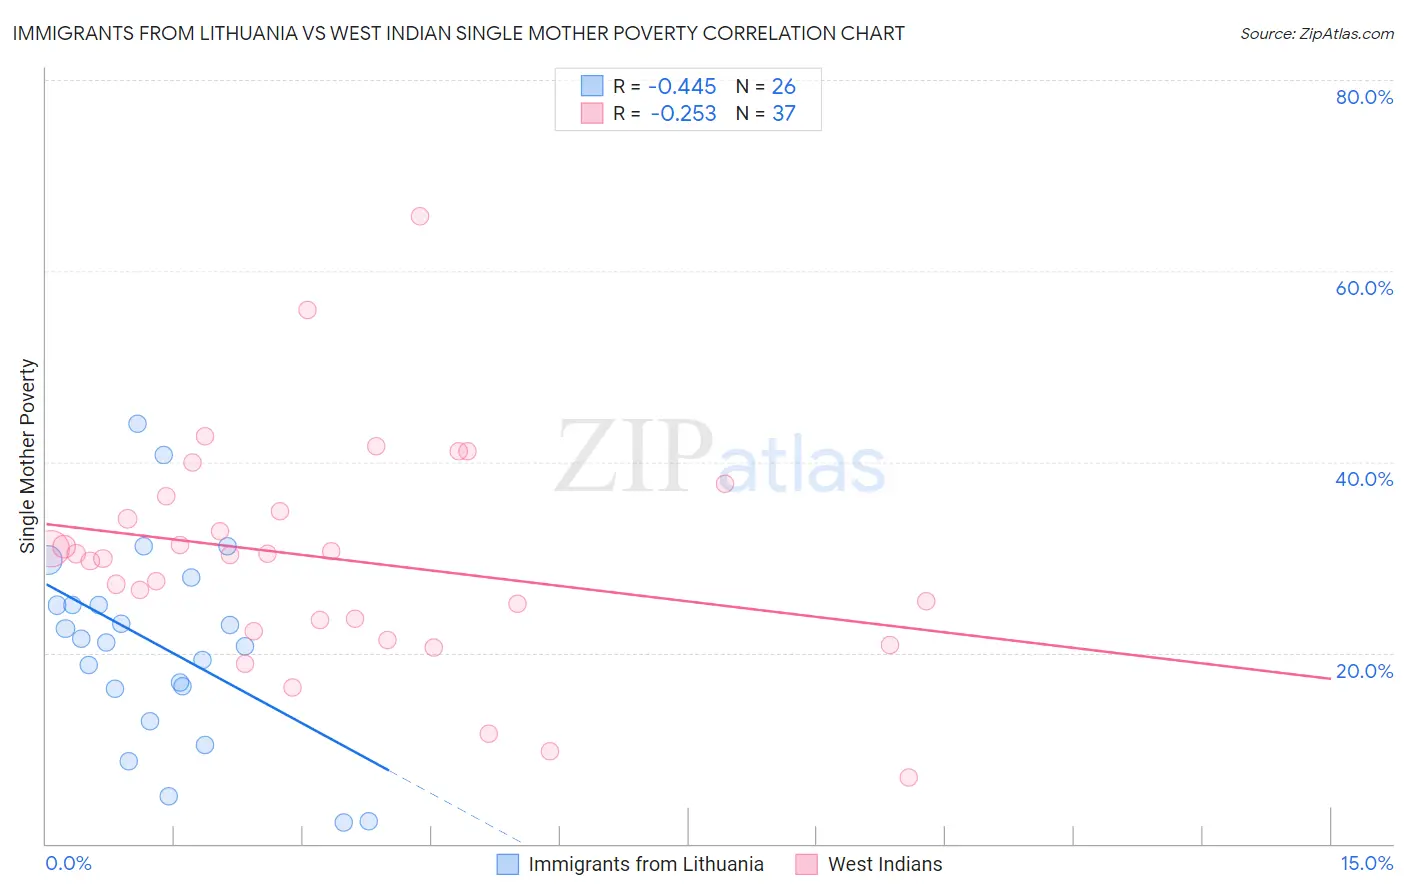
Immigrants from Lithuania vs West Indian Single Mother Poverty Correlation Chart
The statistical analysis conducted on geographies consisting of 116,297,690 people shows a moderate negative correlation between the proportion of Immigrants from Lithuania and poverty level among single mothers in the United States with a correlation coefficient (R) of -0.445 and weighted average of 25.2%. Similarly, the statistical analysis conducted on geographies consisting of 250,715,566 people shows a weak negative correlation between the proportion of West Indians and poverty level among single mothers in the United States with a correlation coefficient (R) of -0.253 and weighted average of 30.8%, a difference of 22.2%.
Single Mother Poverty Correlation Summary
| Measurement | Immigrants from Lithuania | West Indian |
| Minimum | 2.2% | 6.9% |
| Maximum | 44.0% | 65.7% |
| Range | 41.8% | 58.8% |
| Mean | 20.8% | 29.9% |
| Median | 21.3% | 30.3% |
| Interquartile 25% (IQ1) | 16.3% | 22.9% |
| Interquartile 75% (IQ3) | 25.1% | 35.6% |
| Interquartile Range (IQR) | 8.8% | 12.7% |
| Standard Deviation (Sample) | 10.3% | 11.5% |
| Standard Deviation (Population) | 10.1% | 11.4% |
Similar Demographics by Single Mother Poverty
Demographics Similar to Immigrants from Lithuania by Single Mother Poverty
In terms of single mother poverty, the demographic groups most similar to Immigrants from Lithuania are Immigrants from South Central Asia (25.3%, a difference of 0.19%), Immigrants from Iran (25.1%, a difference of 0.41%), Iranian (25.5%, a difference of 1.3%), Bhutanese (25.6%, a difference of 1.6%), and Indian (Asian) (25.8%, a difference of 2.2%).
| Demographics | Rating | Rank | Single Mother Poverty |
| Immigrants | India | 100.0 /100 | #2 | Exceptional 23.8% |
| Immigrants | Taiwan | 100.0 /100 | #3 | Exceptional 23.9% |
| Filipinos | 100.0 /100 | #4 | Exceptional 24.3% |
| Immigrants | Hong Kong | 100.0 /100 | #5 | Exceptional 24.4% |
| Thais | 100.0 /100 | #6 | Exceptional 24.5% |
| Chinese | 100.0 /100 | #7 | Exceptional 24.6% |
| Immigrants | Iran | 100.0 /100 | #8 | Exceptional 25.1% |
| Immigrants | Lithuania | 100.0 /100 | #9 | Exceptional 25.2% |
| Immigrants | South Central Asia | 100.0 /100 | #10 | Exceptional 25.3% |
| Iranians | 100.0 /100 | #11 | Exceptional 25.5% |
| Bhutanese | 100.0 /100 | #12 | Exceptional 25.6% |
| Indians (Asian) | 100.0 /100 | #13 | Exceptional 25.8% |
| Immigrants | Singapore | 100.0 /100 | #14 | Exceptional 25.8% |
| Immigrants | Ireland | 100.0 /100 | #15 | Exceptional 25.8% |
| Bolivians | 100.0 /100 | #16 | Exceptional 25.9% |
Demographics Similar to West Indians by Single Mother Poverty
In terms of single mother poverty, the demographic groups most similar to West Indians are Ecuadorian (30.8%, a difference of 0.040%), French Canadian (30.8%, a difference of 0.040%), Cape Verdean (30.8%, a difference of 0.12%), Vietnamese (30.9%, a difference of 0.26%), and Tlingit-Haida (30.9%, a difference of 0.39%).
| Demographics | Rating | Rank | Single Mother Poverty |
| Salvadorans | 1.8 /100 | #240 | Tragic 30.6% |
| Immigrants | Laos | 1.8 /100 | #241 | Tragic 30.6% |
| Immigrants | Burma/Myanmar | 1.7 /100 | #242 | Tragic 30.6% |
| Bermudans | 1.6 /100 | #243 | Tragic 30.6% |
| French | 1.3 /100 | #244 | Tragic 30.7% |
| Barbadians | 1.3 /100 | #245 | Tragic 30.7% |
| Ecuadorians | 0.9 /100 | #246 | Tragic 30.8% |
| West Indians | 0.9 /100 | #247 | Tragic 30.8% |
| French Canadians | 0.9 /100 | #248 | Tragic 30.8% |
| Cape Verdeans | 0.8 /100 | #249 | Tragic 30.8% |
| Vietnamese | 0.7 /100 | #250 | Tragic 30.9% |
| Tlingit-Haida | 0.6 /100 | #251 | Tragic 30.9% |
| Alaska Natives | 0.6 /100 | #252 | Tragic 30.9% |
| Celtics | 0.6 /100 | #253 | Tragic 30.9% |
| Senegalese | 0.5 /100 | #254 | Tragic 31.0% |