Immigrants from Cameroon vs West Indian Single Mother Poverty
COMPARE
Immigrants from Cameroon
West Indian
Single Mother Poverty
Single Mother Poverty Comparison
Immigrants from Cameroon
West Indians
27.6%
SINGLE MOTHER POVERTY
98.8/ 100
METRIC RATING
82nd/ 347
METRIC RANK
30.8%
SINGLE MOTHER POVERTY
0.9/ 100
METRIC RATING
247th/ 347
METRIC RANK
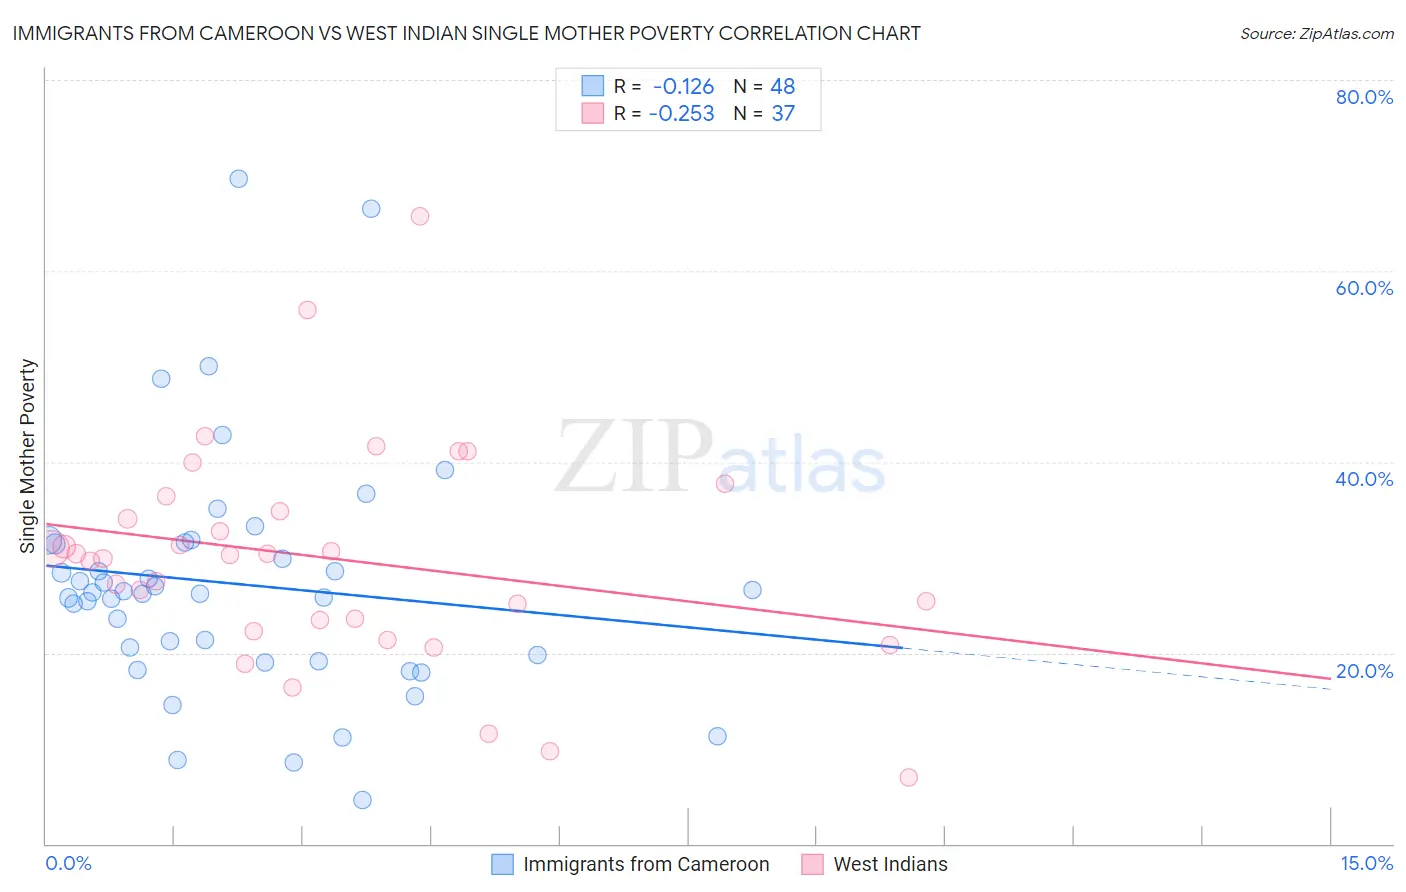
Immigrants from Cameroon vs West Indian Single Mother Poverty Correlation Chart
The statistical analysis conducted on geographies consisting of 129,897,346 people shows a poor negative correlation between the proportion of Immigrants from Cameroon and poverty level among single mothers in the United States with a correlation coefficient (R) of -0.126 and weighted average of 27.6%. Similarly, the statistical analysis conducted on geographies consisting of 250,715,566 people shows a weak negative correlation between the proportion of West Indians and poverty level among single mothers in the United States with a correlation coefficient (R) of -0.253 and weighted average of 30.8%, a difference of 11.5%.
Single Mother Poverty Correlation Summary
| Measurement | Immigrants from Cameroon | West Indian |
| Minimum | 4.5% | 6.9% |
| Maximum | 69.7% | 65.7% |
| Range | 65.2% | 58.8% |
| Mean | 27.2% | 29.9% |
| Median | 26.3% | 30.3% |
| Interquartile 25% (IQ1) | 19.5% | 22.9% |
| Interquartile 75% (IQ3) | 31.4% | 35.6% |
| Interquartile Range (IQR) | 11.9% | 12.7% |
| Standard Deviation (Sample) | 12.7% | 11.5% |
| Standard Deviation (Population) | 12.6% | 11.4% |
Similar Demographics by Single Mother Poverty
Demographics Similar to Immigrants from Cameroon by Single Mother Poverty
In terms of single mother poverty, the demographic groups most similar to Immigrants from Cameroon are Greek (27.7%, a difference of 0.050%), Immigrants from Latvia (27.7%, a difference of 0.090%), Mongolian (27.7%, a difference of 0.090%), Immigrants from Scotland (27.6%, a difference of 0.12%), and Immigrants from Ukraine (27.7%, a difference of 0.18%).
| Demographics | Rating | Rank | Single Mother Poverty |
| Immigrants | Sweden | 99.2 /100 | #75 | Exceptional 27.5% |
| Peruvians | 99.2 /100 | #76 | Exceptional 27.5% |
| Immigrants | Peru | 99.2 /100 | #77 | Exceptional 27.5% |
| Immigrants | North Macedonia | 99.2 /100 | #78 | Exceptional 27.5% |
| Immigrants | Italy | 99.1 /100 | #79 | Exceptional 27.5% |
| Taiwanese | 99.1 /100 | #80 | Exceptional 27.5% |
| Immigrants | Scotland | 98.9 /100 | #81 | Exceptional 27.6% |
| Immigrants | Cameroon | 98.8 /100 | #82 | Exceptional 27.6% |
| Greeks | 98.7 /100 | #83 | Exceptional 27.7% |
| Immigrants | Latvia | 98.7 /100 | #84 | Exceptional 27.7% |
| Mongolians | 98.7 /100 | #85 | Exceptional 27.7% |
| Immigrants | Ukraine | 98.6 /100 | #86 | Exceptional 27.7% |
| Afghans | 98.5 /100 | #87 | Exceptional 27.7% |
| Ethiopians | 98.4 /100 | #88 | Exceptional 27.7% |
| Immigrants | Ethiopia | 98.4 /100 | #89 | Exceptional 27.7% |
Demographics Similar to West Indians by Single Mother Poverty
In terms of single mother poverty, the demographic groups most similar to West Indians are Ecuadorian (30.8%, a difference of 0.040%), French Canadian (30.8%, a difference of 0.040%), Cape Verdean (30.8%, a difference of 0.12%), Vietnamese (30.9%, a difference of 0.26%), and Tlingit-Haida (30.9%, a difference of 0.39%).
| Demographics | Rating | Rank | Single Mother Poverty |
| Salvadorans | 1.8 /100 | #240 | Tragic 30.6% |
| Immigrants | Laos | 1.8 /100 | #241 | Tragic 30.6% |
| Immigrants | Burma/Myanmar | 1.7 /100 | #242 | Tragic 30.6% |
| Bermudans | 1.6 /100 | #243 | Tragic 30.6% |
| French | 1.3 /100 | #244 | Tragic 30.7% |
| Barbadians | 1.3 /100 | #245 | Tragic 30.7% |
| Ecuadorians | 0.9 /100 | #246 | Tragic 30.8% |
| West Indians | 0.9 /100 | #247 | Tragic 30.8% |
| French Canadians | 0.9 /100 | #248 | Tragic 30.8% |
| Cape Verdeans | 0.8 /100 | #249 | Tragic 30.8% |
| Vietnamese | 0.7 /100 | #250 | Tragic 30.9% |
| Tlingit-Haida | 0.6 /100 | #251 | Tragic 30.9% |
| Alaska Natives | 0.6 /100 | #252 | Tragic 30.9% |
| Celtics | 0.6 /100 | #253 | Tragic 30.9% |
| Senegalese | 0.5 /100 | #254 | Tragic 31.0% |