Immigrants from Cuba vs West Indian Single Mother Poverty
COMPARE
Immigrants from Cuba
West Indian
Single Mother Poverty
Single Mother Poverty Comparison
Immigrants from Cuba
West Indians
30.1%
SINGLE MOTHER POVERTY
6.9/ 100
METRIC RATING
223rd/ 347
METRIC RANK
30.8%
SINGLE MOTHER POVERTY
0.9/ 100
METRIC RATING
247th/ 347
METRIC RANK
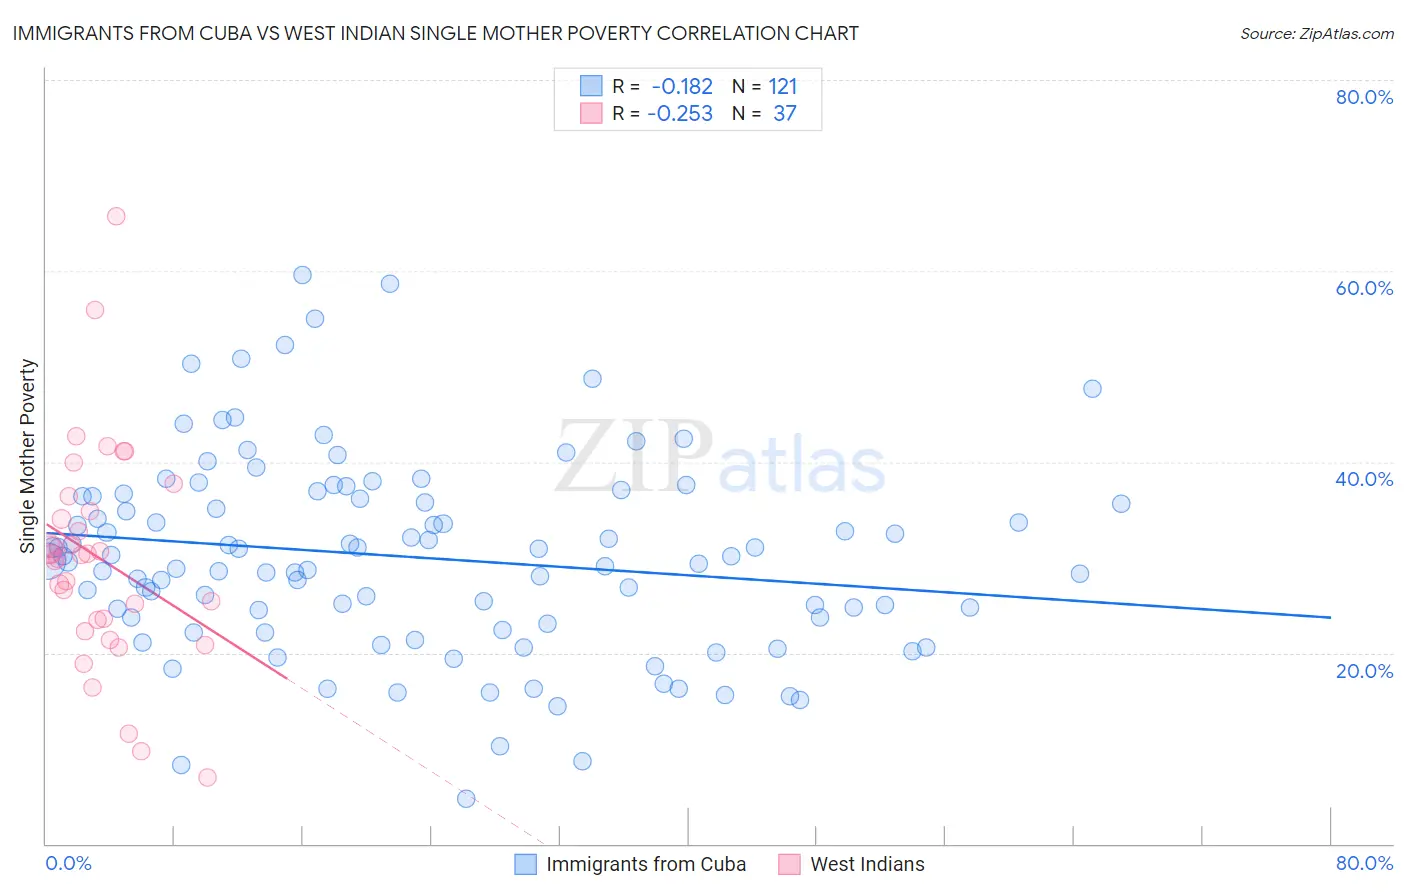
Immigrants from Cuba vs West Indian Single Mother Poverty Correlation Chart
The statistical analysis conducted on geographies consisting of 320,148,902 people shows a poor negative correlation between the proportion of Immigrants from Cuba and poverty level among single mothers in the United States with a correlation coefficient (R) of -0.182 and weighted average of 30.1%. Similarly, the statistical analysis conducted on geographies consisting of 250,715,566 people shows a weak negative correlation between the proportion of West Indians and poverty level among single mothers in the United States with a correlation coefficient (R) of -0.253 and weighted average of 30.8%, a difference of 2.4%.
Single Mother Poverty Correlation Summary
| Measurement | Immigrants from Cuba | West Indian |
| Minimum | 4.7% | 6.9% |
| Maximum | 59.5% | 65.7% |
| Range | 54.9% | 58.8% |
| Mean | 30.0% | 29.9% |
| Median | 29.6% | 30.3% |
| Interquartile 25% (IQ1) | 23.4% | 22.9% |
| Interquartile 75% (IQ3) | 36.4% | 35.6% |
| Interquartile Range (IQR) | 13.0% | 12.7% |
| Standard Deviation (Sample) | 10.3% | 11.5% |
| Standard Deviation (Population) | 10.2% | 11.4% |
Similar Demographics by Single Mother Poverty
Demographics Similar to Immigrants from Cuba by Single Mother Poverty
In terms of single mother poverty, the demographic groups most similar to Immigrants from Cuba are Immigrants from Sudan (30.1%, a difference of 0.070%), Spanish (30.1%, a difference of 0.10%), Sudanese (30.0%, a difference of 0.13%), Immigrants from Eritrea (30.0%, a difference of 0.14%), and Scottish (30.1%, a difference of 0.16%).
| Demographics | Rating | Rank | Single Mother Poverty |
| Immigrants | Western Africa | 11.5 /100 | #216 | Poor 29.9% |
| Immigrants | Ghana | 11.3 /100 | #217 | Poor 29.9% |
| Hungarians | 10.3 /100 | #218 | Poor 29.9% |
| Finns | 9.3 /100 | #219 | Tragic 30.0% |
| Germans | 8.8 /100 | #220 | Tragic 30.0% |
| Immigrants | Eritrea | 7.7 /100 | #221 | Tragic 30.0% |
| Sudanese | 7.6 /100 | #222 | Tragic 30.0% |
| Immigrants | Cuba | 6.9 /100 | #223 | Tragic 30.1% |
| Immigrants | Sudan | 6.5 /100 | #224 | Tragic 30.1% |
| Spanish | 6.3 /100 | #225 | Tragic 30.1% |
| Scottish | 6.0 /100 | #226 | Tragic 30.1% |
| Immigrants | Liberia | 5.9 /100 | #227 | Tragic 30.1% |
| Spaniards | 5.4 /100 | #228 | Tragic 30.2% |
| Immigrants | Barbados | 5.0 /100 | #229 | Tragic 30.2% |
| English | 4.8 /100 | #230 | Tragic 30.2% |
Demographics Similar to West Indians by Single Mother Poverty
In terms of single mother poverty, the demographic groups most similar to West Indians are Ecuadorian (30.8%, a difference of 0.040%), French Canadian (30.8%, a difference of 0.040%), Cape Verdean (30.8%, a difference of 0.12%), Vietnamese (30.9%, a difference of 0.26%), and Tlingit-Haida (30.9%, a difference of 0.39%).
| Demographics | Rating | Rank | Single Mother Poverty |
| Salvadorans | 1.8 /100 | #240 | Tragic 30.6% |
| Immigrants | Laos | 1.8 /100 | #241 | Tragic 30.6% |
| Immigrants | Burma/Myanmar | 1.7 /100 | #242 | Tragic 30.6% |
| Bermudans | 1.6 /100 | #243 | Tragic 30.6% |
| French | 1.3 /100 | #244 | Tragic 30.7% |
| Barbadians | 1.3 /100 | #245 | Tragic 30.7% |
| Ecuadorians | 0.9 /100 | #246 | Tragic 30.8% |
| West Indians | 0.9 /100 | #247 | Tragic 30.8% |
| French Canadians | 0.9 /100 | #248 | Tragic 30.8% |
| Cape Verdeans | 0.8 /100 | #249 | Tragic 30.8% |
| Vietnamese | 0.7 /100 | #250 | Tragic 30.9% |
| Tlingit-Haida | 0.6 /100 | #251 | Tragic 30.9% |
| Alaska Natives | 0.6 /100 | #252 | Tragic 30.9% |
| Celtics | 0.6 /100 | #253 | Tragic 30.9% |
| Senegalese | 0.5 /100 | #254 | Tragic 31.0% |