Immigrants from Lithuania vs Immigrants from Romania Single Mother Poverty

COMPARE

Immigrants from Lithuania
Race
Ancestry
AfghanAfricanAlaska NativeAlaskan AthabascanAlbanianAleutAlsatianAmericanApacheArabArapahoArgentineanArmenianAssyrian/Chaldean/SyriacAustralianAustrianBahamianBangladeshiBarbadianBasqueBelgianBelizeanBermudanBhutaneseBlackfeetBolivianBrazilianBritishBritish West IndianBulgarianBurmeseCajunCambodianCanadianCape VerdeanCarpatho RusynCelticCentral AmericanCentral American IndianCherokeeCheyenneChickasawChileanChineseChippewaChoctawColombianColvilleComancheCosta RicanCreeCreekCroatianCrowCubanCypriotCzechCzechoslovakianDanishDelawareDominicanDutchDutch West IndianEastern EuropeanEcuadorianEgyptianEnglishEstonianEthiopianEuropeanFijianFilipinoFinnishFrenchFrench American IndianFrench CanadianGermanGerman RussianGhanaianGreekGuamanian/ChamorroGuatemalanGuyaneseHaitianHmongHonduranHopiHoumaHungarianIcelanderIndian (Asian)IndonesianInupiatIranianIraqiIrishIroquoisIsraeliItalianJamaicanJapaneseJordanianKenyanKiowaKoreanLaotianLatvianLebaneseLiberianLithuanianLumbeeLuxembourgerMacedonianMalaysianMalteseMarshalleseMenomineeMexicanMexican American IndianMongolianMoroccanNative HawaiianNavajoNepaleseNew ZealanderNicaraguanNigerianNorthern EuropeanNorwegianOkinawanOsageOttawaPaiutePakistaniPalestinianPanamanianParaguayanPennsylvania GermanPeruvianPimaPolishPortuguesePotawatomiPuebloPuerto RicanPuget Sound SalishRomanianRussianSalvadoranSamoanScandinavianScotch-IrishScottishSeminoleSenegaleseSerbianShoshoneSierra LeoneanSiouxSlavicSlovakSloveneSomaliSouth AfricanSouth AmericanSouth American IndianSoviet UnionSpaniardSpanishSpanish AmericanSpanish American IndianSri LankanSubsaharan AfricanSudaneseSwedishSwissSyrianTaiwaneseThaiTlingit-HaidaTohono O'OdhamTonganTrinidadian and TobagonianTsimshianTurkishU.S. Virgin IslanderUgandanUkrainianUruguayanUteVenezuelanVietnameseWelshWest IndianYakamaYaquiYugoslavianYumanYup'ikZimbabwean
Immigration
NonimmigrantsImmigrantsAfghanistanAfricaAlbaniaArgentinaArmeniaAsiaAustraliaAustriaBahamasBangladeshBarbadosBelarusBelgiumBelizeBoliviaBosnia and HerzegovinaBrazilBulgariaBurma/MyanmarCabo VerdeCambodiaCameroonCanadaCaribbeanCentral AmericaChileChinaColombiaCongoCosta RicaCroatiaCubaCzechoslovakiaDenmarkDominicaDominican RepublicEastern AfricaEastern AsiaEastern EuropeEcuadorEgyptEl SalvadorEnglandEritreaEthiopiaEuropeFijiFranceGermanyGhanaGreeceGrenadaGuatemalaGuyanaHaitiHondurasHong KongHungaryIndiaIndonesiaIranIraqIrelandIsraelItalyJamaicaJapanJordanKazakhstanKenyaKoreaKuwaitLaosLatin AmericaLatviaLebanonLiberiaLithuaniaMalaysiaMexicoMicronesiaMiddle AfricaMoldovaMoroccoNepalNetherlandsNicaraguaNigeriaNorth AmericaNorth MacedoniaNorthern AfricaNorthern EuropeNorwayOceaniaPakistanPanamaPeruPhilippinesPolandPortugalRussiaSaudi ArabiaScotlandSenegalSerbiaSierra LeoneSingaporeSomaliaSouth AfricaSouth AmericaSouth Central AsiaSouth Eastern AsiaSouthern EuropeSpainSri LankaSt. Vincent and the GrenadinesSudanSwedenSwitzerlandSyriaTaiwanThailandTrinidad and TobagoTurkeyUgandaUkraineUruguayUzbekistanVenezuelaVietnamWest IndiesWestern AfricaWestern AsiaWestern EuropeYemenZaireZimbabweAzores
Immigrants from Romania
Race
Ancestry
AfghanAfricanAlaska NativeAlaskan AthabascanAlbanianAleutAlsatianAmericanApacheArabArapahoArgentineanArmenianAssyrian/Chaldean/SyriacAustralianAustrianBahamianBangladeshiBarbadianBasqueBelgianBelizeanBermudanBhutaneseBlackfeetBolivianBrazilianBritishBritish West IndianBulgarianBurmeseCajunCambodianCanadianCape VerdeanCarpatho RusynCelticCentral AmericanCentral American IndianCherokeeCheyenneChickasawChileanChineseChippewaChoctawColombianColvilleComancheCosta RicanCreeCreekCroatianCrowCubanCypriotCzechCzechoslovakianDanishDelawareDominicanDutchDutch West IndianEastern EuropeanEcuadorianEgyptianEnglishEstonianEthiopianEuropeanFijianFilipinoFinnishFrenchFrench American IndianFrench CanadianGermanGerman RussianGhanaianGreekGuamanian/ChamorroGuatemalanGuyaneseHaitianHmongHonduranHopiHoumaHungarianIcelanderIndian (Asian)IndonesianInupiatIranianIraqiIrishIroquoisIsraeliItalianJamaicanJapaneseJordanianKenyanKiowaKoreanLaotianLatvianLebaneseLiberianLithuanianLumbeeLuxembourgerMacedonianMalaysianMalteseMarshalleseMenomineeMexicanMexican American IndianMongolianMoroccanNative HawaiianNavajoNepaleseNew ZealanderNicaraguanNigerianNorthern EuropeanNorwegianOkinawanOsageOttawaPaiutePakistaniPalestinianPanamanianParaguayanPennsylvania GermanPeruvianPimaPolishPortuguesePotawatomiPuebloPuerto RicanPuget Sound SalishRomanianRussianSalvadoranSamoanScandinavianScotch-IrishScottishSeminoleSenegaleseSerbianShoshoneSierra LeoneanSiouxSlavicSlovakSloveneSomaliSouth AfricanSouth AmericanSouth American IndianSoviet UnionSpaniardSpanishSpanish AmericanSpanish American IndianSri LankanSubsaharan AfricanSudaneseSwedishSwissSyrianTaiwaneseThaiTlingit-HaidaTohono O'OdhamTonganTrinidadian and TobagonianTsimshianTurkishU.S. Virgin IslanderUgandanUkrainianUruguayanUteVenezuelanVietnameseWelshWest IndianYakamaYaquiYugoslavianYumanYup'ikZimbabwean
Immigration
NonimmigrantsImmigrantsAfghanistanAfricaAlbaniaArgentinaArmeniaAsiaAustraliaAustriaBahamasBangladeshBarbadosBelarusBelgiumBelizeBoliviaBosnia and HerzegovinaBrazilBulgariaBurma/MyanmarCabo VerdeCambodiaCameroonCanadaCaribbeanCentral AmericaChileChinaColombiaCongoCosta RicaCroatiaCubaCzechoslovakiaDenmarkDominicaDominican RepublicEastern AfricaEastern AsiaEastern EuropeEcuadorEgyptEl SalvadorEnglandEritreaEthiopiaEuropeFijiFranceGermanyGhanaGreeceGrenadaGuatemalaGuyanaHaitiHondurasHong KongHungaryIndiaIndonesiaIranIraqIrelandIsraelItalyJamaicaJapanJordanKazakhstanKenyaKoreaKuwaitLaosLatin AmericaLatviaLebanonLiberiaMalaysiaMexicoMicronesiaMiddle AfricaMoldovaMoroccoNepalNetherlandsNicaraguaNigeriaNorth AmericaNorth MacedoniaNorthern AfricaNorthern EuropeNorwayOceaniaPakistanPanamaPeruPhilippinesPolandPortugalRomaniaRussiaSaudi ArabiaScotlandSenegalSerbiaSierra LeoneSingaporeSomaliaSouth AfricaSouth AmericaSouth Central AsiaSouth Eastern AsiaSouthern EuropeSpainSri LankaSt. Vincent and the GrenadinesSudanSwedenSwitzerlandSyriaTaiwanThailandTrinidad and TobagoTurkeyUgandaUkraineUruguayUzbekistanVenezuelaVietnamWest IndiesWestern AfricaWestern AsiaWestern EuropeYemenZaireZimbabweAzores
Single Mother Poverty
Income
Poverty
Unemployment
Labor Participation
Family Structure
Vehicle Availability
Education Level
Disability

Single Mother Poverty Comparison

Immigrants from Lithuania

Immigrants from Romania

Exceptional
Exceptional
25.2%
SINGLE MOTHER POVERTY
100.0/ 100
METRIC RATING
9th/ 347
METRIC RANK
27.2%
SINGLE MOTHER POVERTY
99.7/ 100
METRIC RATING
56th/ 347
METRIC RANK

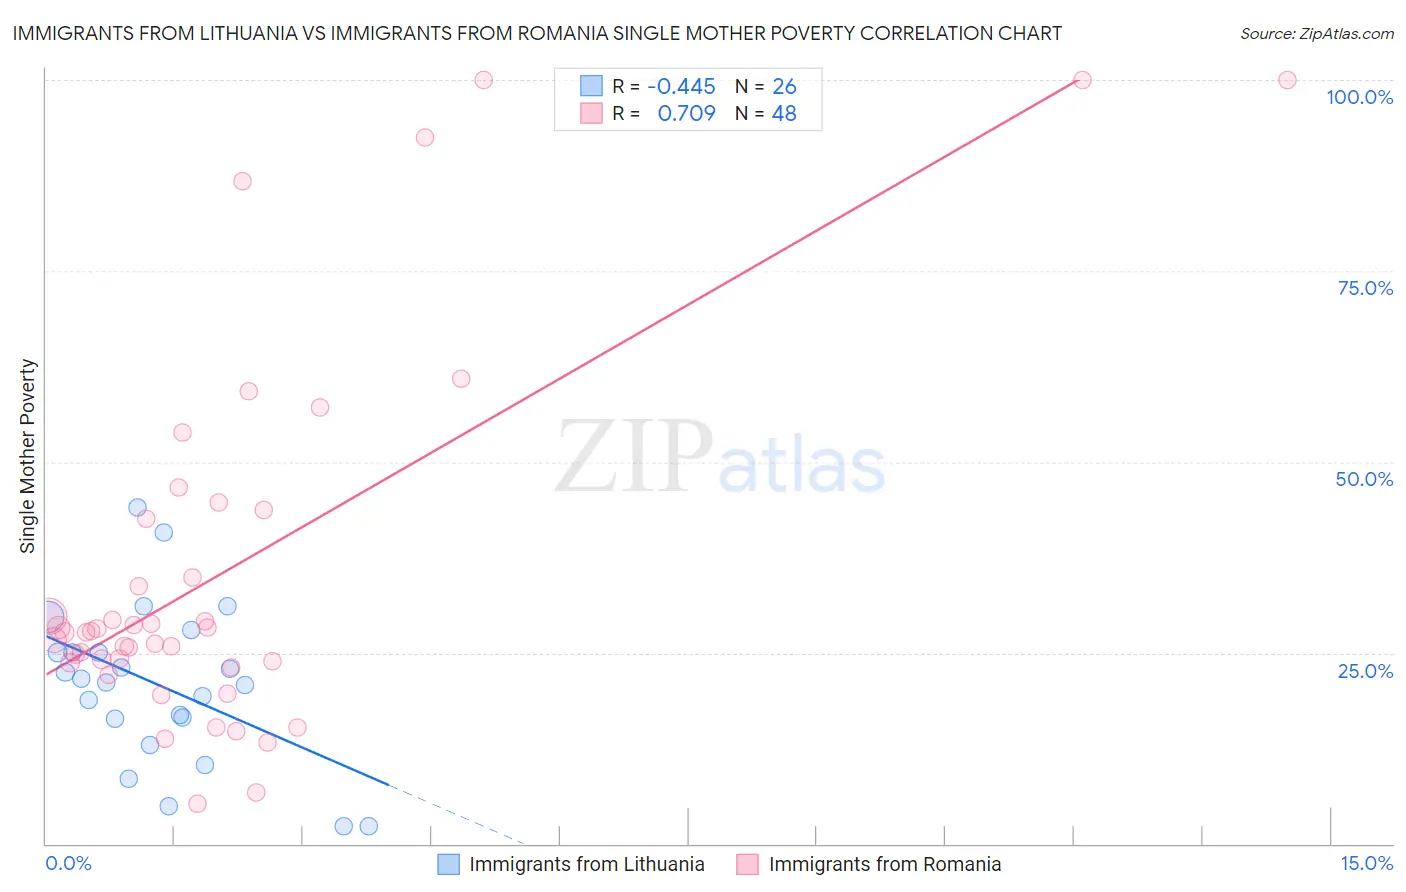
Immigrants from Lithuania vs Immigrants from Romania Single Mother Poverty Correlation Chart

The statistical analysis conducted on geographies consisting of 116,297,690 people shows a moderate negative correlation between the proportion of Immigrants from Lithuania and poverty level among single mothers in the United States with a correlation coefficient (R) of -0.445 and weighted average of 25.2%. Similarly, the statistical analysis conducted on geographies consisting of 252,141,332 people shows a strong positive correlation between the proportion of Immigrants from Romania and poverty level among single mothers in the United States with a correlation coefficient (R) of 0.709 and weighted average of 27.2%, a difference of 7.7%.
Immigrants from Lithuania vs Immigrants from Romania Single Mother Poverty

Single Mother Poverty Correlation Summary

MeasurementImmigrants from LithuaniaImmigrants from Romania
Minimum2.2%5.2%
Maximum44.0%100.0%
Range41.8%94.8%
Mean20.8%35.7%
Median21.3%27.8%
Interquartile 25% (IQ1)16.3%23.8%
Interquartile 75% (IQ3)25.1%43.1%
Interquartile Range (IQR)8.8%19.3%
Standard Deviation (Sample)10.3%24.1%
Standard Deviation (Population)10.1%23.8%

Similar Demographics by Single Mother Poverty

Demographics Similar to Immigrants from Lithuania by Single Mother Poverty

In terms of single mother poverty, the demographic groups most similar to Immigrants from Lithuania are Immigrants from South Central Asia (25.3%, a difference of 0.19%), Immigrants from Iran (25.1%, a difference of 0.41%), Iranian (25.5%, a difference of 1.3%), Bhutanese (25.6%, a difference of 1.6%), and Indian (Asian) (25.8%, a difference of 2.2%).
DemographicsRating | RankSingle Mother Poverty
Immigrants | India
100.0
/100
|
#2
Exceptional
23.8%
Immigrants | Taiwan
100.0
/100
|
#3
Exceptional
23.9%
Filipinos
100.0
/100
|
#4
Exceptional
24.3%
Immigrants | Hong Kong
100.0
/100
|
#5
Exceptional
24.4%
Thais
100.0
/100
|
#6
Exceptional
24.5%
Chinese
100.0
/100
|
#7
Exceptional
24.6%
Immigrants | Iran
100.0
/100
|
#8
Exceptional
25.1%
Immigrants | Lithuania
100.0
/100
|
#9
Exceptional
25.2%
Immigrants | South Central Asia
100.0
/100
|
#10
Exceptional
25.3%
Iranians
100.0
/100
|
#11
Exceptional
25.5%
Bhutanese
100.0
/100
|
#12
Exceptional
25.6%
Indians (Asian)
100.0
/100
|
#13
Exceptional
25.8%
Immigrants | Singapore
100.0
/100
|
#14
Exceptional
25.8%
Immigrants | Ireland
100.0
/100
|
#15
Exceptional
25.8%
Bolivians
100.0
/100
|
#16
Exceptional
25.9%

Demographics Similar to Immigrants from Romania by Single Mother Poverty

In terms of single mother poverty, the demographic groups most similar to Immigrants from Romania are Palestinian (27.2%, a difference of 0.030%), Immigrants from Egypt (27.1%, a difference of 0.050%), Immigrants from Bulgaria (27.1%, a difference of 0.080%), Immigrants from Jordan (27.1%, a difference of 0.11%), and Immigrants from South Eastern Asia (27.1%, a difference of 0.15%).
DemographicsRating | RankSingle Mother Poverty
Cambodians
99.8
/100
|
#49
Exceptional
27.0%
Laotians
99.8
/100
|
#50
Exceptional
27.0%
Immigrants | Argentina
99.7
/100
|
#51
Exceptional
27.1%
Immigrants | South Eastern Asia
99.7
/100
|
#52
Exceptional
27.1%
Immigrants | Jordan
99.7
/100
|
#53
Exceptional
27.1%
Immigrants | Bulgaria
99.7
/100
|
#54
Exceptional
27.1%
Immigrants | Egypt
99.7
/100
|
#55
Exceptional
27.1%
Immigrants | Romania
99.7
/100
|
#56
Exceptional
27.2%
Palestinians
99.7
/100
|
#57
Exceptional
27.2%
Argentineans
99.6
/100
|
#58
Exceptional
27.2%
Paraguayans
99.6
/100
|
#59
Exceptional
27.2%
Eastern Europeans
99.6
/100
|
#60
Exceptional
27.2%
Immigrants | Eastern Europe
99.6
/100
|
#61
Exceptional
27.2%
Immigrants | Malaysia
99.5
/100
|
#62
Exceptional
27.3%
Immigrants | Northern Europe
99.5
/100
|
#63
Exceptional
27.3%