Immigrants from Lithuania vs Australian Single Mother Poverty
COMPARE
Immigrants from Lithuania
Australian
Single Mother Poverty
Single Mother Poverty Comparison
Immigrants from Lithuania
Australians
25.2%
SINGLE MOTHER POVERTY
100.0/ 100
METRIC RATING
9th/ 347
METRIC RANK
28.3%
SINGLE MOTHER POVERTY
92.5/ 100
METRIC RATING
117th/ 347
METRIC RANK
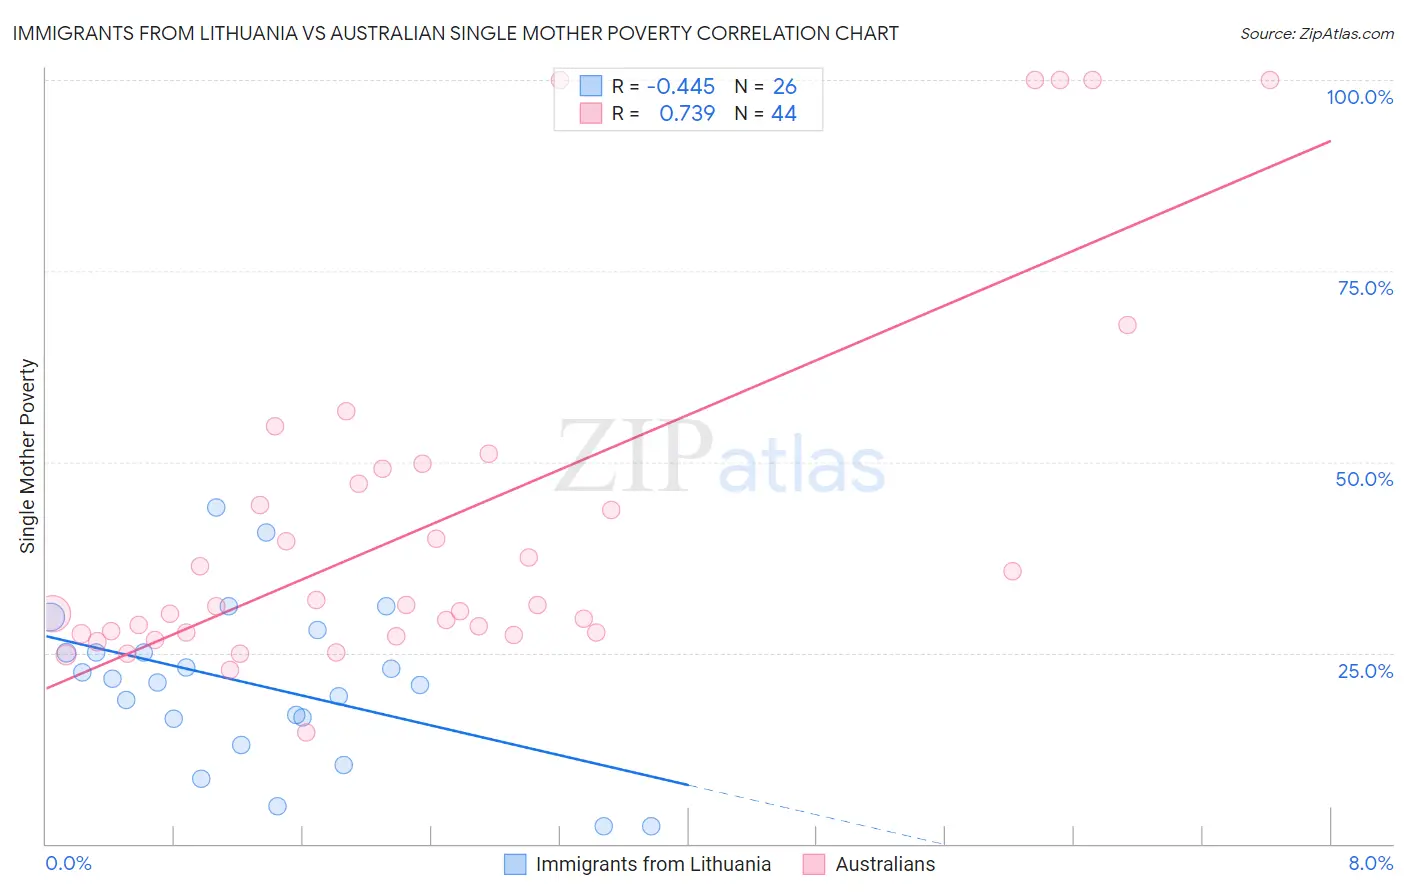
Immigrants from Lithuania vs Australian Single Mother Poverty Correlation Chart
The statistical analysis conducted on geographies consisting of 116,297,690 people shows a moderate negative correlation between the proportion of Immigrants from Lithuania and poverty level among single mothers in the United States with a correlation coefficient (R) of -0.445 and weighted average of 25.2%. Similarly, the statistical analysis conducted on geographies consisting of 220,322,695 people shows a strong positive correlation between the proportion of Australians and poverty level among single mothers in the United States with a correlation coefficient (R) of 0.739 and weighted average of 28.3%, a difference of 12.2%.
Single Mother Poverty Correlation Summary
| Measurement | Immigrants from Lithuania | Australian |
| Minimum | 2.2% | 14.5% |
| Maximum | 44.0% | 100.0% |
| Range | 41.8% | 85.5% |
| Mean | 20.8% | 41.8% |
| Median | 21.3% | 31.2% |
| Interquartile 25% (IQ1) | 16.3% | 27.6% |
| Interquartile 75% (IQ3) | 25.1% | 48.1% |
| Interquartile Range (IQR) | 8.8% | 20.5% |
| Standard Deviation (Sample) | 10.3% | 23.5% |
| Standard Deviation (Population) | 10.1% | 23.2% |
Similar Demographics by Single Mother Poverty
Demographics Similar to Immigrants from Lithuania by Single Mother Poverty
In terms of single mother poverty, the demographic groups most similar to Immigrants from Lithuania are Immigrants from South Central Asia (25.3%, a difference of 0.19%), Immigrants from Iran (25.1%, a difference of 0.41%), Iranian (25.5%, a difference of 1.3%), Bhutanese (25.6%, a difference of 1.6%), and Indian (Asian) (25.8%, a difference of 2.2%).
| Demographics | Rating | Rank | Single Mother Poverty |
| Immigrants | India | 100.0 /100 | #2 | Exceptional 23.8% |
| Immigrants | Taiwan | 100.0 /100 | #3 | Exceptional 23.9% |
| Filipinos | 100.0 /100 | #4 | Exceptional 24.3% |
| Immigrants | Hong Kong | 100.0 /100 | #5 | Exceptional 24.4% |
| Thais | 100.0 /100 | #6 | Exceptional 24.5% |
| Chinese | 100.0 /100 | #7 | Exceptional 24.6% |
| Immigrants | Iran | 100.0 /100 | #8 | Exceptional 25.1% |
| Immigrants | Lithuania | 100.0 /100 | #9 | Exceptional 25.2% |
| Immigrants | South Central Asia | 100.0 /100 | #10 | Exceptional 25.3% |
| Iranians | 100.0 /100 | #11 | Exceptional 25.5% |
| Bhutanese | 100.0 /100 | #12 | Exceptional 25.6% |
| Indians (Asian) | 100.0 /100 | #13 | Exceptional 25.8% |
| Immigrants | Singapore | 100.0 /100 | #14 | Exceptional 25.8% |
| Immigrants | Ireland | 100.0 /100 | #15 | Exceptional 25.8% |
| Bolivians | 100.0 /100 | #16 | Exceptional 25.9% |
Demographics Similar to Australians by Single Mother Poverty
In terms of single mother poverty, the demographic groups most similar to Australians are Immigrants from Uganda (28.3%, a difference of 0.010%), Brazilian (28.3%, a difference of 0.010%), Immigrants from Syria (28.3%, a difference of 0.020%), Immigrants from Kuwait (28.3%, a difference of 0.030%), and Immigrants from Western Asia (28.3%, a difference of 0.040%).
| Demographics | Rating | Rank | Single Mother Poverty |
| Croatians | 94.8 /100 | #110 | Exceptional 28.2% |
| Venezuelans | 94.5 /100 | #111 | Exceptional 28.2% |
| Immigrants | Kazakhstan | 94.5 /100 | #112 | Exceptional 28.2% |
| Immigrants | South Africa | 93.2 /100 | #113 | Exceptional 28.3% |
| Immigrants | Western Asia | 92.7 /100 | #114 | Exceptional 28.3% |
| Immigrants | Kuwait | 92.7 /100 | #115 | Exceptional 28.3% |
| Immigrants | Uganda | 92.5 /100 | #116 | Exceptional 28.3% |
| Australians | 92.5 /100 | #117 | Exceptional 28.3% |
| Brazilians | 92.4 /100 | #118 | Exceptional 28.3% |
| Immigrants | Syria | 92.4 /100 | #119 | Exceptional 28.3% |
| Cypriots | 92.3 /100 | #120 | Exceptional 28.3% |
| Immigrants | Afghanistan | 92.1 /100 | #121 | Exceptional 28.3% |
| Colombians | 91.8 /100 | #122 | Exceptional 28.3% |
| Uruguayans | 91.7 /100 | #123 | Exceptional 28.3% |
| Immigrants | Switzerland | 91.7 /100 | #124 | Exceptional 28.3% |