Immigrants from Lithuania vs Immigrants from Dominica Single Mother Poverty

COMPARE

Immigrants from Lithuania
Race
Ancestry
AfghanAfricanAlaska NativeAlaskan AthabascanAlbanianAleutAlsatianAmericanApacheArabArapahoArgentineanArmenianAssyrian/Chaldean/SyriacAustralianAustrianBahamianBangladeshiBarbadianBasqueBelgianBelizeanBermudanBhutaneseBlackfeetBolivianBrazilianBritishBritish West IndianBulgarianBurmeseCajunCambodianCanadianCape VerdeanCarpatho RusynCelticCentral AmericanCentral American IndianCherokeeCheyenneChickasawChileanChineseChippewaChoctawColombianColvilleComancheCosta RicanCreeCreekCroatianCrowCubanCypriotCzechCzechoslovakianDanishDelawareDominicanDutchDutch West IndianEastern EuropeanEcuadorianEgyptianEnglishEstonianEthiopianEuropeanFijianFilipinoFinnishFrenchFrench American IndianFrench CanadianGermanGerman RussianGhanaianGreekGuamanian/ChamorroGuatemalanGuyaneseHaitianHmongHonduranHopiHoumaHungarianIcelanderIndian (Asian)IndonesianInupiatIranianIraqiIrishIroquoisIsraeliItalianJamaicanJapaneseJordanianKenyanKiowaKoreanLaotianLatvianLebaneseLiberianLithuanianLumbeeLuxembourgerMacedonianMalaysianMalteseMarshalleseMenomineeMexicanMexican American IndianMongolianMoroccanNative HawaiianNavajoNepaleseNew ZealanderNicaraguanNigerianNorthern EuropeanNorwegianOkinawanOsageOttawaPaiutePakistaniPalestinianPanamanianParaguayanPennsylvania GermanPeruvianPimaPolishPortuguesePotawatomiPuebloPuerto RicanPuget Sound SalishRomanianRussianSalvadoranSamoanScandinavianScotch-IrishScottishSeminoleSenegaleseSerbianShoshoneSierra LeoneanSiouxSlavicSlovakSloveneSomaliSouth AfricanSouth AmericanSouth American IndianSoviet UnionSpaniardSpanishSpanish AmericanSpanish American IndianSri LankanSubsaharan AfricanSudaneseSwedishSwissSyrianTaiwaneseThaiTlingit-HaidaTohono O'OdhamTonganTrinidadian and TobagonianTsimshianTurkishU.S. Virgin IslanderUgandanUkrainianUruguayanUteVenezuelanVietnameseWelshWest IndianYakamaYaquiYugoslavianYumanYup'ikZimbabwean
Immigration
NonimmigrantsImmigrantsAfghanistanAfricaAlbaniaArgentinaArmeniaAsiaAustraliaAustriaBahamasBangladeshBarbadosBelarusBelgiumBelizeBoliviaBosnia and HerzegovinaBrazilBulgariaBurma/MyanmarCabo VerdeCambodiaCameroonCanadaCaribbeanCentral AmericaChileChinaColombiaCongoCosta RicaCroatiaCubaCzechoslovakiaDenmarkDominican RepublicEastern AfricaEastern AsiaEastern EuropeEcuadorEgyptEl SalvadorEnglandEritreaEthiopiaEuropeFijiFranceGermanyGhanaGreeceGrenadaGuatemalaGuyanaHaitiHondurasHong KongHungaryIndiaIndonesiaIranIraqIrelandIsraelItalyJamaicaJapanJordanKazakhstanKenyaKoreaKuwaitLaosLatin AmericaLatviaLebanonLiberiaLithuaniaMalaysiaMexicoMicronesiaMiddle AfricaMoldovaMoroccoNepalNetherlandsNicaraguaNigeriaNorth AmericaNorth MacedoniaNorthern AfricaNorthern EuropeNorwayOceaniaPakistanPanamaPeruPhilippinesPolandPortugalRomaniaRussiaSaudi ArabiaScotlandSenegalSerbiaSierra LeoneSingaporeSomaliaSouth AfricaSouth AmericaSouth Central AsiaSouth Eastern AsiaSouthern EuropeSpainSri LankaSt. Vincent and the GrenadinesSudanSwedenSwitzerlandSyriaTaiwanThailandTrinidad and TobagoTurkeyUgandaUkraineUruguayUzbekistanVenezuelaVietnamWest IndiesWestern AfricaWestern AsiaWestern EuropeYemenZaireZimbabweAzores
Immigrants from Dominica
Race
Ancestry
AfghanAfricanAlaska NativeAlaskan AthabascanAlbanianAleutAlsatianAmericanApacheArabArapahoArgentineanArmenianAssyrian/Chaldean/SyriacAustralianAustrianBahamianBangladeshiBarbadianBasqueBelgianBelizeanBermudanBhutaneseBlackfeetBolivianBrazilianBritishBritish West IndianBulgarianBurmeseCajunCambodianCanadianCape VerdeanCarpatho RusynCelticCentral AmericanCentral American IndianCherokeeCheyenneChickasawChileanChineseChippewaChoctawColombianColvilleComancheCosta RicanCreeCreekCroatianCrowCubanCypriotCzechCzechoslovakianDanishDelawareDominicanDutchDutch West IndianEastern EuropeanEcuadorianEgyptianEnglishEstonianEthiopianEuropeanFijianFilipinoFinnishFrenchFrench American IndianFrench CanadianGermanGerman RussianGhanaianGreekGuamanian/ChamorroGuatemalanGuyaneseHaitianHmongHonduranHopiHoumaHungarianIcelanderIndian (Asian)IndonesianInupiatIranianIraqiIrishIroquoisIsraeliItalianJamaicanJapaneseJordanianKenyanKiowaKoreanLaotianLatvianLebaneseLiberianLithuanianLumbeeLuxembourgerMacedonianMalaysianMalteseMarshalleseMenomineeMexicanMexican American IndianMongolianMoroccanNative HawaiianNavajoNepaleseNew ZealanderNicaraguanNigerianNorthern EuropeanNorwegianOkinawanOsageOttawaPaiutePakistaniPalestinianPanamanianParaguayanPennsylvania GermanPeruvianPimaPolishPortuguesePotawatomiPuebloPuerto RicanPuget Sound SalishRomanianRussianSalvadoranSamoanScandinavianScotch-IrishScottishSeminoleSenegaleseSerbianShoshoneSierra LeoneanSiouxSlavicSlovakSloveneSomaliSouth AfricanSouth AmericanSouth American IndianSoviet UnionSpaniardSpanishSpanish AmericanSpanish American IndianSri LankanSubsaharan AfricanSudaneseSwedishSwissSyrianTaiwaneseThaiTlingit-HaidaTohono O'OdhamTonganTrinidadian and TobagonianTsimshianTurkishU.S. Virgin IslanderUgandanUkrainianUruguayanUteVenezuelanVietnameseWelshWest IndianYakamaYaquiYugoslavianYumanYup'ikZimbabwean
Immigration
NonimmigrantsImmigrantsAfghanistanAfricaAlbaniaArgentinaArmeniaAsiaAustraliaAustriaBahamasBangladeshBarbadosBelarusBelgiumBelizeBoliviaBosnia and HerzegovinaBrazilBulgariaBurma/MyanmarCabo VerdeCambodiaCameroonCanadaCaribbeanCentral AmericaChileChinaColombiaCongoCosta RicaCroatiaCubaCzechoslovakiaDenmarkDominicaDominican RepublicEastern AfricaEastern AsiaEastern EuropeEcuadorEgyptEl SalvadorEnglandEritreaEthiopiaEuropeFijiFranceGermanyGhanaGreeceGrenadaGuatemalaGuyanaHaitiHondurasHong KongHungaryIndiaIndonesiaIranIraqIrelandIsraelItalyJamaicaJapanJordanKazakhstanKenyaKoreaKuwaitLaosLatin AmericaLatviaLebanonLiberiaMalaysiaMexicoMicronesiaMiddle AfricaMoldovaMoroccoNepalNetherlandsNicaraguaNigeriaNorth AmericaNorth MacedoniaNorthern AfricaNorthern EuropeNorwayOceaniaPakistanPanamaPeruPhilippinesPolandPortugalRomaniaRussiaSaudi ArabiaScotlandSenegalSerbiaSierra LeoneSingaporeSomaliaSouth AfricaSouth AmericaSouth Central AsiaSouth Eastern AsiaSouthern EuropeSpainSri LankaSt. Vincent and the GrenadinesSudanSwedenSwitzerlandSyriaTaiwanThailandTrinidad and TobagoTurkeyUgandaUkraineUruguayUzbekistanVenezuelaVietnamWest IndiesWestern AfricaWestern AsiaWestern EuropeYemenZaireZimbabweAzores
Single Mother Poverty
Income
Poverty
Unemployment
Labor Participation
Family Structure
Vehicle Availability
Education Level
Disability

Single Mother Poverty Comparison

Immigrants from Lithuania

Immigrants from Dominica

Exceptional
Tragic
25.2%
SINGLE MOTHER POVERTY
100.0/ 100
METRIC RATING
9th/ 347
METRIC RANK
32.5%
SINGLE MOTHER POVERTY
0.0/ 100
METRIC RATING
287th/ 347
METRIC RANK

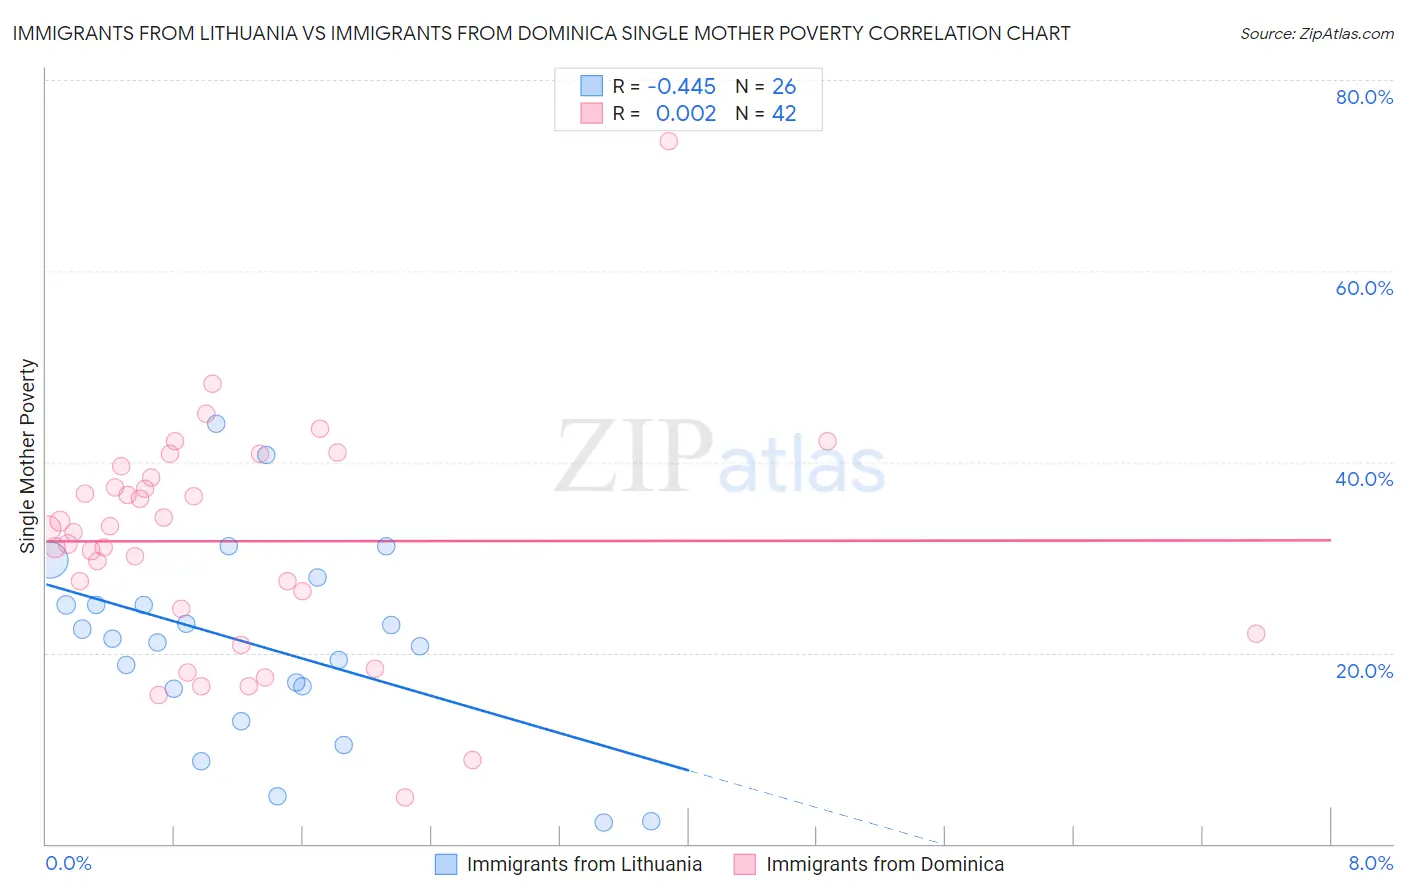
Immigrants from Lithuania vs Immigrants from Dominica Single Mother Poverty Correlation Chart

The statistical analysis conducted on geographies consisting of 116,297,690 people shows a moderate negative correlation between the proportion of Immigrants from Lithuania and poverty level among single mothers in the United States with a correlation coefficient (R) of -0.445 and weighted average of 25.2%. Similarly, the statistical analysis conducted on geographies consisting of 83,555,072 people shows no correlation between the proportion of Immigrants from Dominica and poverty level among single mothers in the United States with a correlation coefficient (R) of 0.002 and weighted average of 32.5%, a difference of 28.9%.
Immigrants from Lithuania vs Immigrants from Dominica Single Mother Poverty

Single Mother Poverty Correlation Summary

MeasurementImmigrants from LithuaniaImmigrants from Dominica
Minimum2.2%4.9%
Maximum44.0%73.5%
Range41.8%68.7%
Mean20.8%31.7%
Median21.3%32.8%
Interquartile 25% (IQ1)16.3%24.6%
Interquartile 75% (IQ3)25.1%38.3%
Interquartile Range (IQR)8.8%13.7%
Standard Deviation (Sample)10.3%12.0%
Standard Deviation (Population)10.1%11.9%

Similar Demographics by Single Mother Poverty

Demographics Similar to Immigrants from Lithuania by Single Mother Poverty

In terms of single mother poverty, the demographic groups most similar to Immigrants from Lithuania are Immigrants from South Central Asia (25.3%, a difference of 0.19%), Immigrants from Iran (25.1%, a difference of 0.41%), Iranian (25.5%, a difference of 1.3%), Bhutanese (25.6%, a difference of 1.6%), and Indian (Asian) (25.8%, a difference of 2.2%).
DemographicsRating | RankSingle Mother Poverty
Immigrants | India
100.0
/100
|
#2
Exceptional
23.8%
Immigrants | Taiwan
100.0
/100
|
#3
Exceptional
23.9%
Filipinos
100.0
/100
|
#4
Exceptional
24.3%
Immigrants | Hong Kong
100.0
/100
|
#5
Exceptional
24.4%
Thais
100.0
/100
|
#6
Exceptional
24.5%
Chinese
100.0
/100
|
#7
Exceptional
24.6%
Immigrants | Iran
100.0
/100
|
#8
Exceptional
25.1%
Immigrants | Lithuania
100.0
/100
|
#9
Exceptional
25.2%
Immigrants | South Central Asia
100.0
/100
|
#10
Exceptional
25.3%
Iranians
100.0
/100
|
#11
Exceptional
25.5%
Bhutanese
100.0
/100
|
#12
Exceptional
25.6%
Indians (Asian)
100.0
/100
|
#13
Exceptional
25.8%
Immigrants | Singapore
100.0
/100
|
#14
Exceptional
25.8%
Immigrants | Ireland
100.0
/100
|
#15
Exceptional
25.8%
Bolivians
100.0
/100
|
#16
Exceptional
25.9%

Demographics Similar to Immigrants from Dominica by Single Mother Poverty

In terms of single mother poverty, the demographic groups most similar to Immigrants from Dominica are Yup'ik (32.5%, a difference of 0.13%), Immigrants from Latin America (32.4%, a difference of 0.20%), Somali (32.6%, a difference of 0.23%), U.S. Virgin Islander (32.6%, a difference of 0.25%), and Indonesian (32.4%, a difference of 0.31%).
DemographicsRating | RankSingle Mother Poverty
Immigrants | Nonimmigrants
0.0
/100
|
#280
Tragic
32.2%
Cree
0.0
/100
|
#281
Tragic
32.2%
Immigrants | Azores
0.0
/100
|
#282
Tragic
32.2%
Spanish Americans
0.0
/100
|
#283
Tragic
32.3%
Indonesians
0.0
/100
|
#284
Tragic
32.4%
Immigrants | Latin America
0.0
/100
|
#285
Tragic
32.4%
Yup'ik
0.0
/100
|
#286
Tragic
32.5%
Immigrants | Dominica
0.0
/100
|
#287
Tragic
32.5%
Somalis
0.0
/100
|
#288
Tragic
32.6%
U.S. Virgin Islanders
0.0
/100
|
#289
Tragic
32.6%
Osage
0.0
/100
|
#290
Tragic
32.6%
Guatemalans
0.0
/100
|
#291
Tragic
32.9%
Shoshone
0.0
/100
|
#292
Tragic
32.9%
Aleuts
0.0
/100
|
#293
Tragic
32.9%
French American Indians
0.0
/100
|
#294
Tragic
33.1%