Ottawa vs West Indian Single Mother Poverty
COMPARE
Ottawa
West Indian
Single Mother Poverty
Single Mother Poverty Comparison
Ottawa
West Indians
35.5%
SINGLE MOTHER POVERTY
0.0/ 100
METRIC RATING
324th/ 347
METRIC RANK
30.8%
SINGLE MOTHER POVERTY
0.9/ 100
METRIC RATING
247th/ 347
METRIC RANK
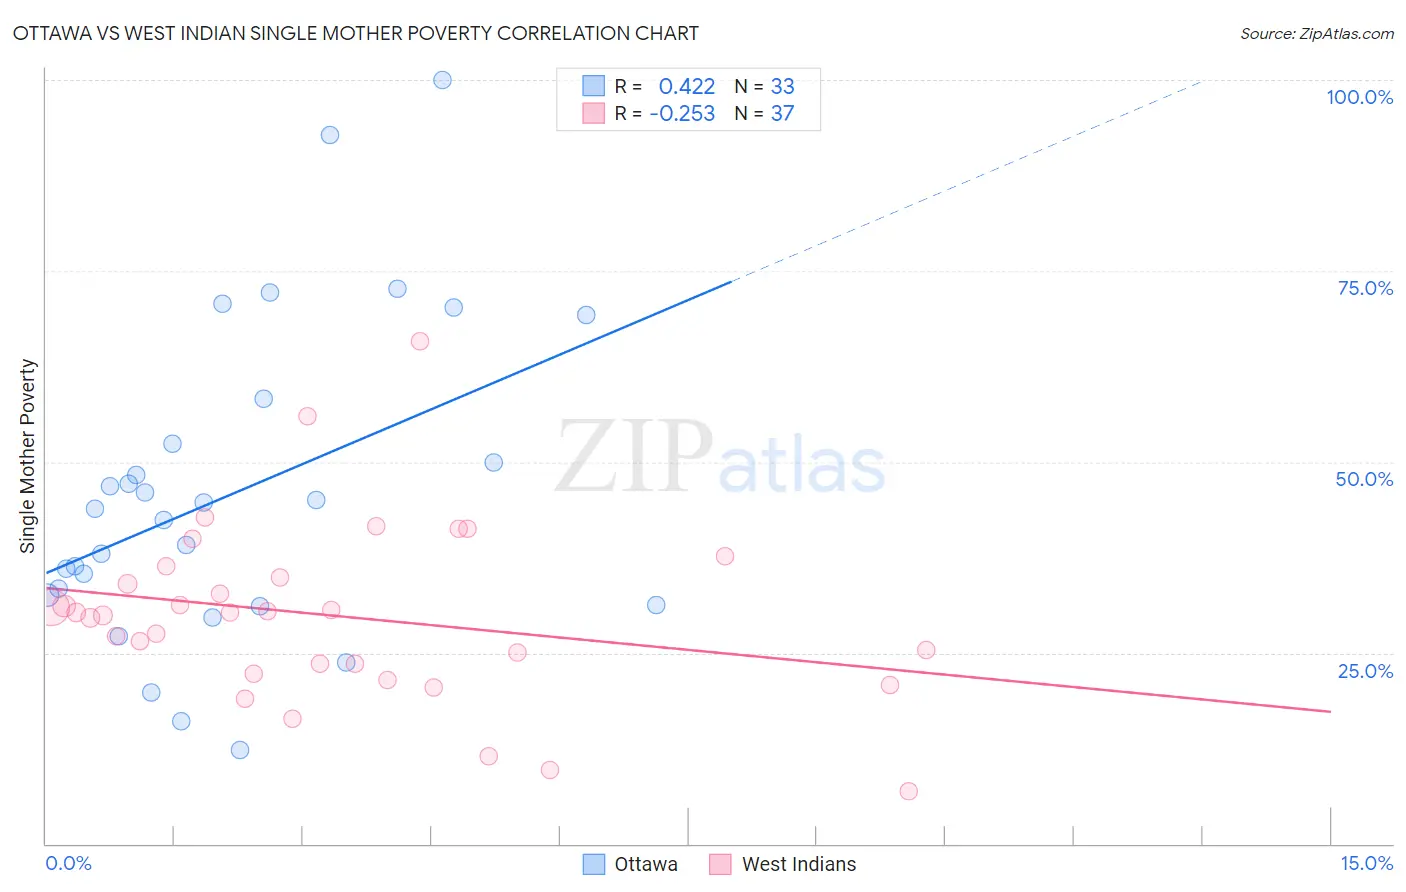
Ottawa vs West Indian Single Mother Poverty Correlation Chart
The statistical analysis conducted on geographies consisting of 49,602,464 people shows a moderate positive correlation between the proportion of Ottawa and poverty level among single mothers in the United States with a correlation coefficient (R) of 0.422 and weighted average of 35.5%. Similarly, the statistical analysis conducted on geographies consisting of 250,715,566 people shows a weak negative correlation between the proportion of West Indians and poverty level among single mothers in the United States with a correlation coefficient (R) of -0.253 and weighted average of 30.8%, a difference of 15.4%.
Single Mother Poverty Correlation Summary
| Measurement | Ottawa | West Indian |
| Minimum | 12.2% | 6.9% |
| Maximum | 100.0% | 65.7% |
| Range | 87.8% | 58.8% |
| Mean | 45.9% | 29.9% |
| Median | 43.8% | 30.3% |
| Interquartile 25% (IQ1) | 31.9% | 22.9% |
| Interquartile 75% (IQ3) | 55.3% | 35.6% |
| Interquartile Range (IQR) | 23.5% | 12.7% |
| Standard Deviation (Sample) | 20.6% | 11.5% |
| Standard Deviation (Population) | 20.3% | 11.4% |
Similar Demographics by Single Mother Poverty
Demographics Similar to Ottawa by Single Mother Poverty
In terms of single mother poverty, the demographic groups most similar to Ottawa are Kiowa (35.5%, a difference of 0.21%), Ute (35.7%, a difference of 0.48%), Seminole (35.8%, a difference of 0.78%), Black/African American (35.2%, a difference of 0.92%), and Paiute (35.1%, a difference of 1.1%).
| Demographics | Rating | Rank | Single Mother Poverty |
| Cherokee | 0.0 /100 | #317 | Tragic 34.5% |
| Immigrants | Honduras | 0.0 /100 | #318 | Tragic 34.7% |
| Chippewa | 0.0 /100 | #319 | Tragic 34.8% |
| Iroquois | 0.0 /100 | #320 | Tragic 34.8% |
| Paiute | 0.0 /100 | #321 | Tragic 35.1% |
| Blacks/African Americans | 0.0 /100 | #322 | Tragic 35.2% |
| Kiowa | 0.0 /100 | #323 | Tragic 35.5% |
| Ottawa | 0.0 /100 | #324 | Tragic 35.5% |
| Ute | 0.0 /100 | #325 | Tragic 35.7% |
| Seminole | 0.0 /100 | #326 | Tragic 35.8% |
| Yakama | 0.0 /100 | #327 | Tragic 36.4% |
| Choctaw | 0.0 /100 | #328 | Tragic 36.4% |
| Apache | 0.0 /100 | #329 | Tragic 36.6% |
| Natives/Alaskans | 0.0 /100 | #330 | Tragic 36.6% |
| Creek | 0.0 /100 | #331 | Tragic 36.7% |
Demographics Similar to West Indians by Single Mother Poverty
In terms of single mother poverty, the demographic groups most similar to West Indians are Ecuadorian (30.8%, a difference of 0.040%), French Canadian (30.8%, a difference of 0.040%), Cape Verdean (30.8%, a difference of 0.12%), Vietnamese (30.9%, a difference of 0.26%), and Tlingit-Haida (30.9%, a difference of 0.39%).
| Demographics | Rating | Rank | Single Mother Poverty |
| Salvadorans | 1.8 /100 | #240 | Tragic 30.6% |
| Immigrants | Laos | 1.8 /100 | #241 | Tragic 30.6% |
| Immigrants | Burma/Myanmar | 1.7 /100 | #242 | Tragic 30.6% |
| Bermudans | 1.6 /100 | #243 | Tragic 30.6% |
| French | 1.3 /100 | #244 | Tragic 30.7% |
| Barbadians | 1.3 /100 | #245 | Tragic 30.7% |
| Ecuadorians | 0.9 /100 | #246 | Tragic 30.8% |
| West Indians | 0.9 /100 | #247 | Tragic 30.8% |
| French Canadians | 0.9 /100 | #248 | Tragic 30.8% |
| Cape Verdeans | 0.8 /100 | #249 | Tragic 30.8% |
| Vietnamese | 0.7 /100 | #250 | Tragic 30.9% |
| Tlingit-Haida | 0.6 /100 | #251 | Tragic 30.9% |
| Alaska Natives | 0.6 /100 | #252 | Tragic 30.9% |
| Celtics | 0.6 /100 | #253 | Tragic 30.9% |
| Senegalese | 0.5 /100 | #254 | Tragic 31.0% |