Immigrants from Latvia vs Italian Single Female Poverty
COMPARE
Immigrants from Latvia
Italian
Single Female Poverty
Single Female Poverty Comparison
Immigrants from Latvia
Italians
19.3%
SINGLE FEMALE POVERTY
99.4/ 100
METRIC RATING
72nd/ 347
METRIC RANK
19.6%
SINGLE FEMALE POVERTY
98.8/ 100
METRIC RATING
92nd/ 347
METRIC RANK
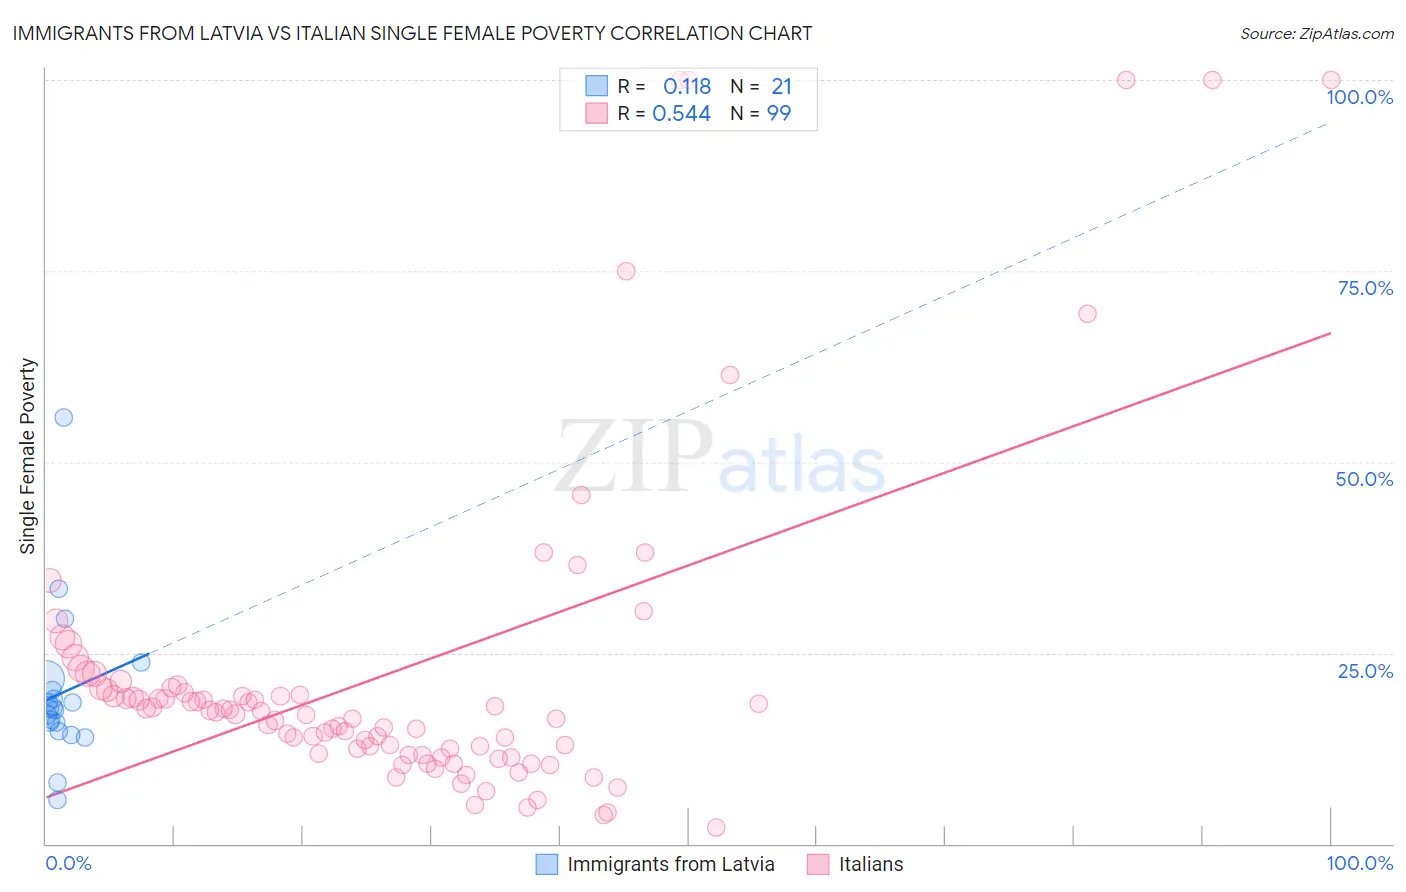
Immigrants from Latvia vs Italian Single Female Poverty Correlation Chart
The statistical analysis conducted on geographies consisting of 112,952,917 people shows a poor positive correlation between the proportion of Immigrants from Latvia and poverty level among single females in the United States with a correlation coefficient (R) of 0.118 and weighted average of 19.3%. Similarly, the statistical analysis conducted on geographies consisting of 553,969,430 people shows a substantial positive correlation between the proportion of Italians and poverty level among single females in the United States with a correlation coefficient (R) of 0.544 and weighted average of 19.6%, a difference of 1.3%.
Single Female Poverty Correlation Summary
| Measurement | Immigrants from Latvia | Italian |
| Minimum | 5.7% | 2.0% |
| Maximum | 55.9% | 100.0% |
| Range | 50.1% | 98.0% |
| Mean | 19.7% | 22.4% |
| Median | 17.6% | 17.3% |
| Interquartile 25% (IQ1) | 15.3% | 11.8% |
| Interquartile 75% (IQ3) | 20.9% | 20.4% |
| Interquartile Range (IQR) | 5.6% | 8.6% |
| Standard Deviation (Sample) | 10.2% | 21.4% |
| Standard Deviation (Population) | 10.0% | 21.3% |
Demographics Similar to Immigrants from Latvia and Italians by Single Female Poverty
In terms of single female poverty, the demographic groups most similar to Immigrants from Latvia are Immigrants from Peru (19.3%, a difference of 0.10%), Immigrants from Belarus (19.3%, a difference of 0.11%), Immigrants from Turkey (19.4%, a difference of 0.15%), Peruvian (19.4%, a difference of 0.19%), and Immigrants from Russia (19.4%, a difference of 0.31%). Similarly, the demographic groups most similar to Italians are Soviet Union (19.6%, a difference of 0.050%), Immigrants from Lebanon (19.6%, a difference of 0.11%), Immigrants from Ukraine (19.5%, a difference of 0.29%), Afghan (19.5%, a difference of 0.30%), and Zimbabwean (19.5%, a difference of 0.31%).
| Demographics | Rating | Rank | Single Female Poverty |
| Immigrants | Latvia | 99.4 /100 | #72 | Exceptional 19.3% |
| Immigrants | Peru | 99.4 /100 | #73 | Exceptional 19.3% |
| Immigrants | Belarus | 99.4 /100 | #74 | Exceptional 19.3% |
| Immigrants | Turkey | 99.4 /100 | #75 | Exceptional 19.4% |
| Peruvians | 99.4 /100 | #76 | Exceptional 19.4% |
| Immigrants | Russia | 99.3 /100 | #77 | Exceptional 19.4% |
| Albanians | 99.3 /100 | #78 | Exceptional 19.4% |
| Immigrants | Sierra Leone | 99.3 /100 | #79 | Exceptional 19.4% |
| Immigrants | Australia | 99.3 /100 | #80 | Exceptional 19.4% |
| Immigrants | Scotland | 99.2 /100 | #81 | Exceptional 19.4% |
| Immigrants | Malaysia | 99.2 /100 | #82 | Exceptional 19.4% |
| Taiwanese | 99.2 /100 | #83 | Exceptional 19.4% |
| Immigrants | Sweden | 99.2 /100 | #84 | Exceptional 19.4% |
| Immigrants | Albania | 99.2 /100 | #85 | Exceptional 19.4% |
| Greeks | 99.2 /100 | #86 | Exceptional 19.4% |
| Zimbabweans | 99.0 /100 | #87 | Exceptional 19.5% |
| Afghans | 99.0 /100 | #88 | Exceptional 19.5% |
| Immigrants | Ukraine | 99.0 /100 | #89 | Exceptional 19.5% |
| Immigrants | Lebanon | 98.8 /100 | #90 | Exceptional 19.6% |
| Soviet Union | 98.8 /100 | #91 | Exceptional 19.6% |
| Italians | 98.8 /100 | #92 | Exceptional 19.6% |