Immigrants from Latin America vs Celtic Child Poverty Among Girls Under 16

COMPARE

Immigrants from Latin America
Race
Ancestry
AfghanAfricanAlaska NativeAlaskan AthabascanAlbanianAleutAlsatianAmericanApacheArabArapahoArgentineanArmenianAssyrian/Chaldean/SyriacAustralianAustrianBahamianBangladeshiBarbadianBasqueBelgianBelizeanBermudanBhutaneseBlackfeetBolivianBrazilianBritishBritish West IndianBulgarianBurmeseCajunCambodianCanadianCape VerdeanCarpatho RusynCentral AmericanCentral American IndianCherokeeCheyenneChickasawChileanChineseChippewaChoctawColombianColvilleComancheCosta RicanCreeCreekCroatianCrowCubanCypriotCzechCzechoslovakianDanishDelawareDominicanDutchDutch West IndianEastern EuropeanEcuadorianEgyptianEnglishEstonianEthiopianEuropeanFijianFilipinoFinnishFrenchFrench American IndianFrench CanadianGermanGerman RussianGhanaianGreekGuamanian/ChamorroGuatemalanGuyaneseHaitianHmongHonduranHopiHoumaHungarianIcelanderIndian (Asian)IndonesianInupiatIranianIraqiIrishIroquoisIsraeliItalianJamaicanJapaneseJordanianKenyanKiowaKoreanLaotianLatvianLebaneseLiberianLithuanianLumbeeLuxembourgerMacedonianMalaysianMalteseMarshalleseMenomineeMexicanMexican American IndianMongolianMoroccanNative HawaiianNavajoNepaleseNew ZealanderNicaraguanNigerianNorthern EuropeanNorwegianOkinawanOsageOttawaPaiutePakistaniPalestinianPanamanianParaguayanPennsylvania GermanPeruvianPimaPolishPortuguesePotawatomiPuebloPuerto RicanPuget Sound SalishRomanianRussianSalvadoranSamoanScandinavianScotch-IrishScottishSeminoleSenegaleseSerbianShoshoneSierra LeoneanSiouxSlavicSlovakSloveneSomaliSouth AfricanSouth AmericanSouth American IndianSoviet UnionSpaniardSpanishSpanish AmericanSpanish American IndianSri LankanSubsaharan AfricanSudaneseSwedishSwissSyrianTaiwaneseThaiTlingit-HaidaTohono O'OdhamTonganTrinidadian and TobagonianTsimshianTurkishU.S. Virgin IslanderUgandanUkrainianUruguayanUteVenezuelanVietnameseWelshWest IndianYakamaYaquiYugoslavianYumanYup'ikZimbabwean
Immigration
NonimmigrantsImmigrantsAfghanistanAfricaAlbaniaArgentinaArmeniaAsiaAustraliaAustriaBahamasBangladeshBarbadosBelarusBelgiumBelizeBoliviaBosnia and HerzegovinaBrazilBulgariaBurma/MyanmarCabo VerdeCambodiaCameroonCanadaCaribbeanCentral AmericaChileChinaColombiaCongoCosta RicaCroatiaCubaCzechoslovakiaDenmarkDominicaDominican RepublicEastern AfricaEastern AsiaEastern EuropeEcuadorEgyptEl SalvadorEnglandEritreaEthiopiaEuropeFijiFranceGermanyGhanaGreeceGrenadaGuatemalaGuyanaHaitiHondurasHong KongHungaryIndiaIndonesiaIranIraqIrelandIsraelItalyJamaicaJapanJordanKazakhstanKenyaKoreaKuwaitLaosLatin AmericaLatviaLebanonLiberiaLithuaniaMalaysiaMexicoMicronesiaMiddle AfricaMoldovaMoroccoNepalNetherlandsNicaraguaNigeriaNorth AmericaNorth MacedoniaNorthern AfricaNorthern EuropeNorwayOceaniaPakistanPanamaPeruPhilippinesPolandPortugalRomaniaRussiaSaudi ArabiaScotlandSenegalSerbiaSierra LeoneSingaporeSomaliaSouth AfricaSouth AmericaSouth Central AsiaSouth Eastern AsiaSouthern EuropeSpainSri LankaSt. Vincent and the GrenadinesSudanSwedenSwitzerlandSyriaTaiwanThailandTrinidad and TobagoTurkeyUgandaUkraineUruguayUzbekistanVenezuelaVietnamWest IndiesWestern AfricaWestern AsiaWestern EuropeYemenZaireZimbabweAzores
Celtic
Race
Ancestry
AfghanAfricanAlaska NativeAlaskan AthabascanAlbanianAleutAlsatianAmericanApacheArabArapahoArgentineanArmenianAssyrian/Chaldean/SyriacAustralianAustrianBahamianBangladeshiBarbadianBasqueBelgianBelizeanBermudanBhutaneseBlackfeetBolivianBrazilianBritishBritish West IndianBulgarianBurmeseCajunCambodianCanadianCape VerdeanCarpatho RusynCelticCentral AmericanCentral American IndianCherokeeCheyenneChickasawChileanChineseChippewaChoctawColombianColvilleComancheCosta RicanCreeCreekCroatianCrowCubanCypriotCzechCzechoslovakianDanishDelawareDominicanDutchDutch West IndianEastern EuropeanEcuadorianEgyptianEnglishEstonianEthiopianEuropeanFijianFilipinoFinnishFrenchFrench American IndianFrench CanadianGermanGerman RussianGhanaianGreekGuamanian/ChamorroGuatemalanGuyaneseHaitianHmongHonduranHopiHoumaHungarianIcelanderIndian (Asian)IndonesianInupiatIranianIraqiIrishIroquoisIsraeliItalianJamaicanJapaneseJordanianKenyanKiowaKoreanLaotianLatvianLebaneseLiberianLithuanianLumbeeLuxembourgerMacedonianMalaysianMalteseMarshalleseMenomineeMexicanMexican American IndianMongolianMoroccanNative HawaiianNavajoNepaleseNew ZealanderNicaraguanNigerianNorthern EuropeanNorwegianOkinawanOsageOttawaPaiutePakistaniPalestinianPanamanianParaguayanPennsylvania GermanPeruvianPimaPolishPortuguesePotawatomiPuebloPuerto RicanPuget Sound SalishRomanianRussianSalvadoranSamoanScandinavianScotch-IrishScottishSeminoleSenegaleseSerbianShoshoneSierra LeoneanSiouxSlavicSlovakSloveneSomaliSouth AfricanSouth AmericanSouth American IndianSoviet UnionSpaniardSpanishSpanish AmericanSpanish American IndianSri LankanSubsaharan AfricanSudaneseSwedishSwissSyrianTaiwaneseThaiTlingit-HaidaTohono O'OdhamTonganTrinidadian and TobagonianTsimshianTurkishU.S. Virgin IslanderUgandanUkrainianUruguayanUteVenezuelanVietnameseWelshWest IndianYakamaYaquiYugoslavianYumanYup'ikZimbabwean
Immigration
NonimmigrantsImmigrantsAfghanistanAfricaAlbaniaArgentinaArmeniaAsiaAustraliaAustriaBahamasBangladeshBarbadosBelarusBelgiumBelizeBoliviaBosnia and HerzegovinaBrazilBulgariaBurma/MyanmarCabo VerdeCambodiaCameroonCanadaCaribbeanCentral AmericaChileChinaColombiaCongoCosta RicaCroatiaCubaCzechoslovakiaDenmarkDominicaDominican RepublicEastern AfricaEastern AsiaEastern EuropeEcuadorEgyptEl SalvadorEnglandEritreaEthiopiaEuropeFijiFranceGermanyGhanaGreeceGrenadaGuatemalaGuyanaHaitiHondurasHong KongHungaryIndiaIndonesiaIranIraqIrelandIsraelItalyJamaicaJapanJordanKazakhstanKenyaKoreaKuwaitLaosLatviaLebanonLiberiaLithuaniaMalaysiaMexicoMicronesiaMiddle AfricaMoldovaMoroccoNepalNetherlandsNicaraguaNigeriaNorth AmericaNorth MacedoniaNorthern AfricaNorthern EuropeNorwayOceaniaPakistanPanamaPeruPhilippinesPolandPortugalRomaniaRussiaSaudi ArabiaScotlandSenegalSerbiaSierra LeoneSingaporeSomaliaSouth AfricaSouth AmericaSouth Central AsiaSouth Eastern AsiaSouthern EuropeSpainSri LankaSt. Vincent and the GrenadinesSudanSwedenSwitzerlandSyriaTaiwanThailandTrinidad and TobagoTurkeyUgandaUkraineUruguayUzbekistanVenezuelaVietnamWest IndiesWestern AfricaWestern AsiaWestern EuropeYemenZaireZimbabweAzores
Child Poverty Among Girls Under 16
Income
Poverty
Unemployment
Labor Participation
Family Structure
Vehicle Availability
Education Level
Disability

Child Poverty Among Girls Under 16 Comparison

Immigrants from Latin America

Celtics

Tragic
Fair
20.6%
CHILD POVERTY AMONG GIRLS UNDER 16
0.0/ 100
METRIC RATING
292nd/ 347
METRIC RANK
17.0%
CHILD POVERTY AMONG GIRLS UNDER 16
25.2/ 100
METRIC RATING
196th/ 347
METRIC RANK

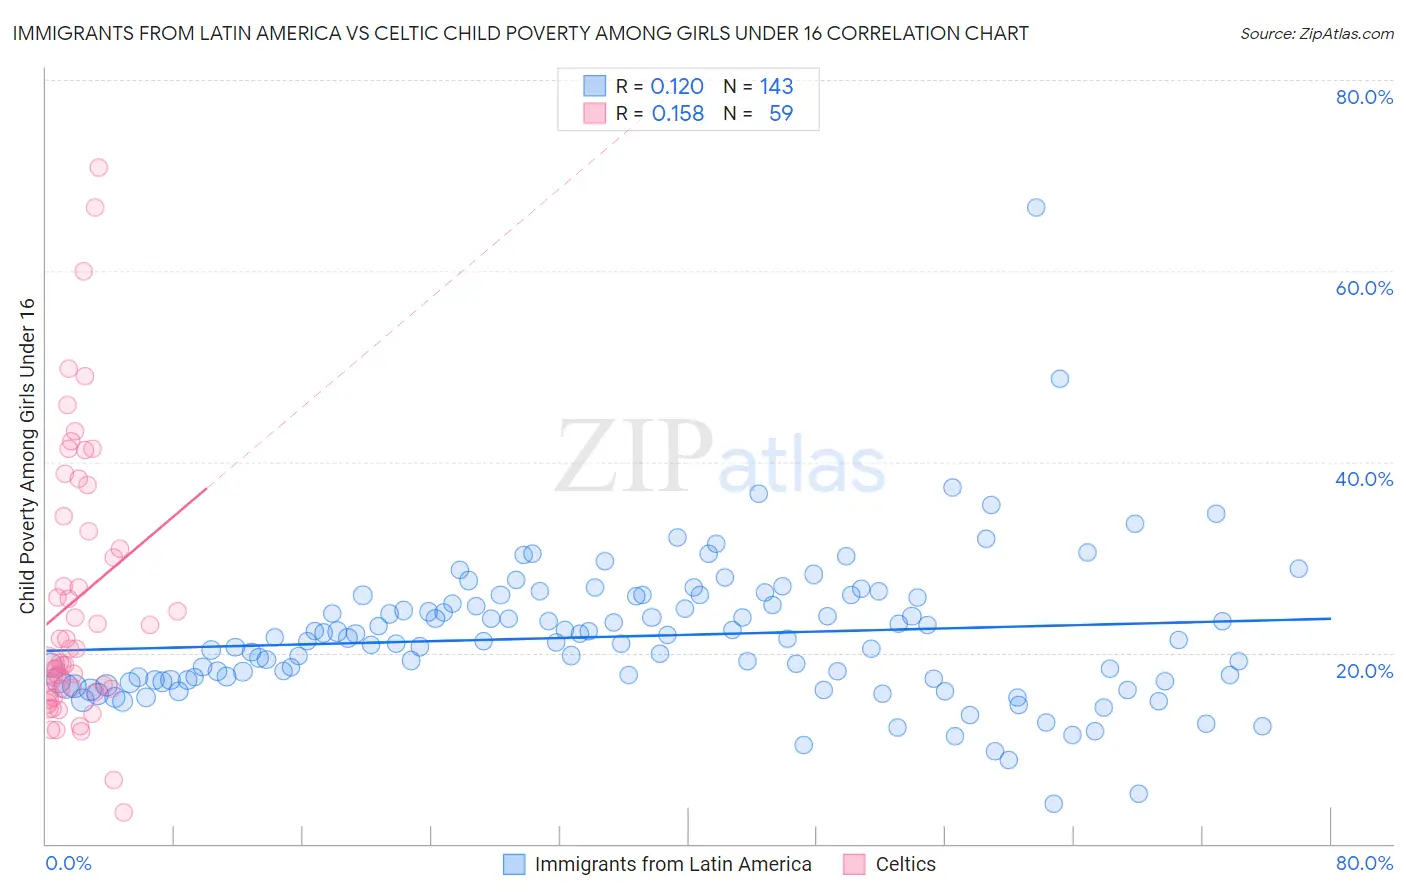
Immigrants from Latin America vs Celtic Child Poverty Among Girls Under 16 Correlation Chart

The statistical analysis conducted on geographies consisting of 539,700,311 people shows a poor positive correlation between the proportion of Immigrants from Latin America and poverty level among girls under the age of 16 in the United States with a correlation coefficient (R) of 0.120 and weighted average of 20.6%. Similarly, the statistical analysis conducted on geographies consisting of 167,177,387 people shows a poor positive correlation between the proportion of Celtics and poverty level among girls under the age of 16 in the United States with a correlation coefficient (R) of 0.158 and weighted average of 17.0%, a difference of 21.6%.
Immigrants from Latin America vs Celtic Child Poverty Among Girls Under 16

Child Poverty Among Girls Under 16 Correlation Summary

MeasurementImmigrants from Latin AmericaCeltic
Minimum4.2%3.3%
Maximum66.7%70.9%
Range62.5%67.6%
Mean21.7%25.7%
Median21.2%20.4%
Interquartile 25% (IQ1)17.2%15.9%
Interquartile 75% (IQ3)25.9%34.3%
Interquartile Range (IQR)8.7%18.4%
Standard Deviation (Sample)7.5%14.5%
Standard Deviation (Population)7.5%14.3%

Similar Demographics by Child Poverty Among Girls Under 16

Demographics Similar to Immigrants from Latin America by Child Poverty Among Girls Under 16

In terms of child poverty among girls under 16, the demographic groups most similar to Immigrants from Latin America are Immigrants from Grenada (20.7%, a difference of 0.040%), Chippewa (20.6%, a difference of 0.070%), Immigrants from Senegal (20.7%, a difference of 0.15%), Immigrants from Caribbean (20.7%, a difference of 0.19%), and Immigrants from Haiti (20.6%, a difference of 0.20%).
DemographicsRating | RankChild Poverty Among Girls Under 16
Immigrants | Cabo Verde
0.0
/100
|
#285
Tragic
20.3%
Iroquois
0.0
/100
|
#286
Tragic
20.4%
Blackfeet
0.0
/100
|
#287
Tragic
20.5%
Haitians
0.0
/100
|
#288
Tragic
20.5%
Immigrants | Belize
0.0
/100
|
#289
Tragic
20.6%
Immigrants | Haiti
0.0
/100
|
#290
Tragic
20.6%
Chippewa
0.0
/100
|
#291
Tragic
20.6%
Immigrants | Latin America
0.0
/100
|
#292
Tragic
20.6%
Immigrants | Grenada
0.0
/100
|
#293
Tragic
20.7%
Immigrants | Senegal
0.0
/100
|
#294
Tragic
20.7%
Immigrants | Caribbean
0.0
/100
|
#295
Tragic
20.7%
Immigrants | West Indies
0.0
/100
|
#296
Tragic
20.7%
Inupiat
0.0
/100
|
#297
Tragic
20.8%
Mexicans
0.0
/100
|
#298
Tragic
20.9%
Hispanics or Latinos
0.0
/100
|
#299
Tragic
21.0%

Demographics Similar to Celtics by Child Poverty Among Girls Under 16

In terms of child poverty among girls under 16, the demographic groups most similar to Celtics are Immigrants from Costa Rica (17.0%, a difference of 0.050%), Spaniard (17.0%, a difference of 0.050%), Immigrants from Lebanon (17.1%, a difference of 0.41%), Immigrants from Afghanistan (17.1%, a difference of 0.43%), and Spanish (16.9%, a difference of 0.48%).
DemographicsRating | RankChild Poverty Among Girls Under 16
Immigrants | Bosnia and Herzegovina
32.5
/100
|
#189
Fair
16.8%
Kenyans
32.3
/100
|
#190
Fair
16.8%
Immigrants | Azores
31.3
/100
|
#191
Fair
16.8%
Immigrants | Uganda
31.3
/100
|
#192
Fair
16.8%
Aleuts
28.7
/100
|
#193
Fair
16.9%
Spanish
28.6
/100
|
#194
Fair
16.9%
Immigrants | Costa Rica
25.6
/100
|
#195
Fair
17.0%
Celtics
25.2
/100
|
#196
Fair
17.0%
Spaniards
24.9
/100
|
#197
Fair
17.0%
Immigrants | Lebanon
22.6
/100
|
#198
Fair
17.1%
Immigrants | Afghanistan
22.4
/100
|
#199
Fair
17.1%
Immigrants | Uzbekistan
21.5
/100
|
#200
Fair
17.1%
Immigrants | Kenya
17.8
/100
|
#201
Poor
17.2%
Immigrants | Sierra Leone
17.6
/100
|
#202
Poor
17.2%
Ugandans
17.5
/100
|
#203
Poor
17.2%