Immigrants from Latin America vs Hopi Child Poverty Among Girls Under 16
COMPARE
Immigrants from Latin America
Hopi
Child Poverty Among Girls Under 16
Child Poverty Among Girls Under 16 Comparison
Immigrants from Latin America
Hopi
20.6%
CHILD POVERTY AMONG GIRLS UNDER 16
0.0/ 100
METRIC RATING
292nd/ 347
METRIC RANK
27.9%
CHILD POVERTY AMONG GIRLS UNDER 16
0.0/ 100
METRIC RATING
341st/ 347
METRIC RANK
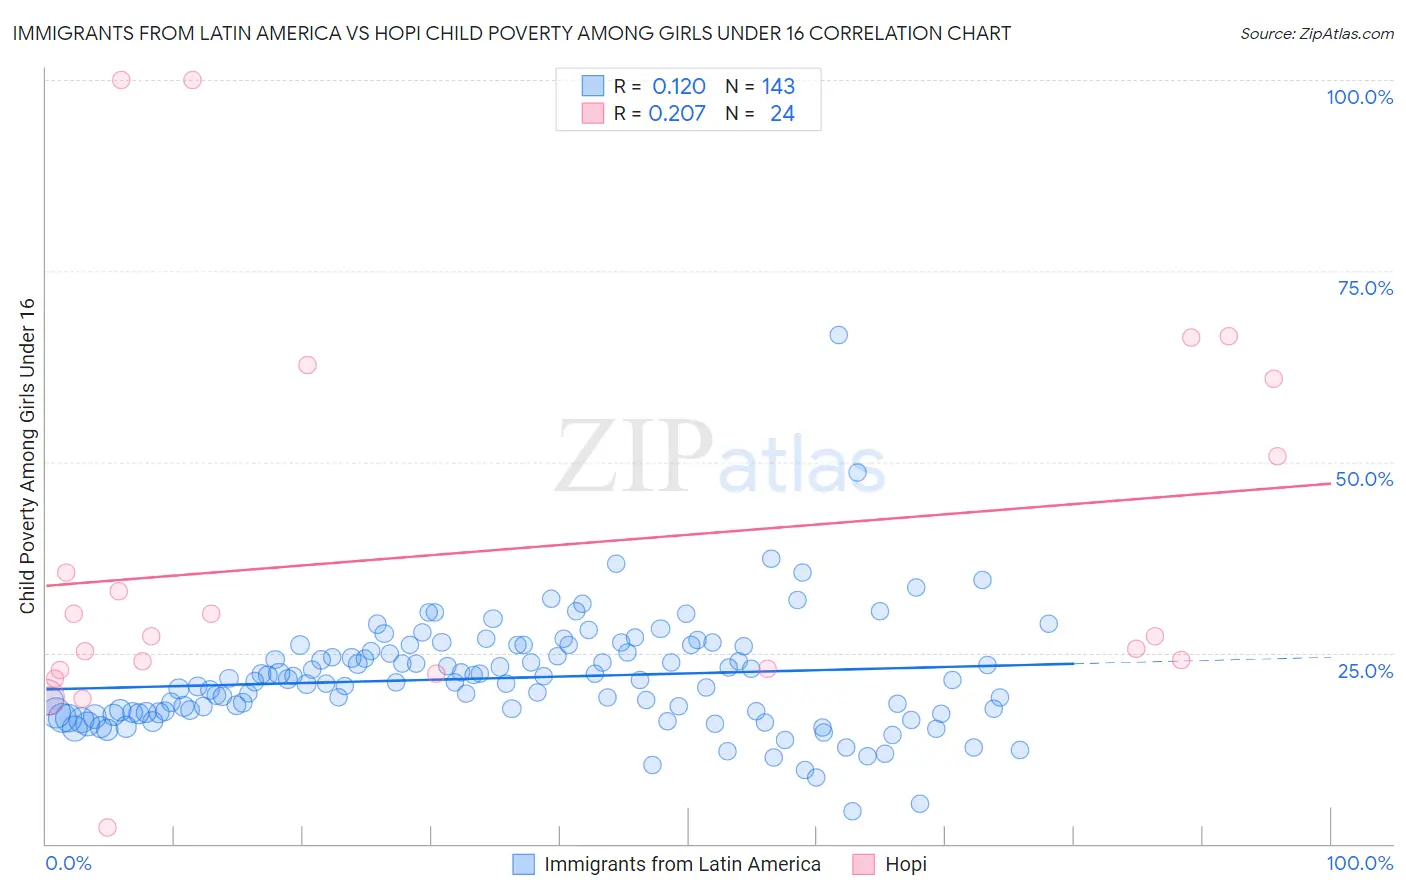
Immigrants from Latin America vs Hopi Child Poverty Among Girls Under 16 Correlation Chart
The statistical analysis conducted on geographies consisting of 539,700,311 people shows a poor positive correlation between the proportion of Immigrants from Latin America and poverty level among girls under the age of 16 in the United States with a correlation coefficient (R) of 0.120 and weighted average of 20.6%. Similarly, the statistical analysis conducted on geographies consisting of 74,572,915 people shows a weak positive correlation between the proportion of Hopi and poverty level among girls under the age of 16 in the United States with a correlation coefficient (R) of 0.207 and weighted average of 27.9%, a difference of 34.9%.
Child Poverty Among Girls Under 16 Correlation Summary
| Measurement | Immigrants from Latin America | Hopi |
| Minimum | 4.2% | 2.1% |
| Maximum | 66.7% | 100.0% |
| Range | 62.5% | 97.9% |
| Mean | 21.7% | 38.3% |
| Median | 21.2% | 27.2% |
| Interquartile 25% (IQ1) | 17.2% | 22.8% |
| Interquartile 75% (IQ3) | 25.9% | 55.8% |
| Interquartile Range (IQR) | 8.7% | 33.0% |
| Standard Deviation (Sample) | 7.5% | 25.3% |
| Standard Deviation (Population) | 7.5% | 24.7% |
Similar Demographics by Child Poverty Among Girls Under 16
Demographics Similar to Immigrants from Latin America by Child Poverty Among Girls Under 16
In terms of child poverty among girls under 16, the demographic groups most similar to Immigrants from Latin America are Immigrants from Grenada (20.7%, a difference of 0.040%), Chippewa (20.6%, a difference of 0.070%), Immigrants from Senegal (20.7%, a difference of 0.15%), Immigrants from Caribbean (20.7%, a difference of 0.19%), and Immigrants from Haiti (20.6%, a difference of 0.20%).
| Demographics | Rating | Rank | Child Poverty Among Girls Under 16 |
| Immigrants | Cabo Verde | 0.0 /100 | #285 | Tragic 20.3% |
| Iroquois | 0.0 /100 | #286 | Tragic 20.4% |
| Blackfeet | 0.0 /100 | #287 | Tragic 20.5% |
| Haitians | 0.0 /100 | #288 | Tragic 20.5% |
| Immigrants | Belize | 0.0 /100 | #289 | Tragic 20.6% |
| Immigrants | Haiti | 0.0 /100 | #290 | Tragic 20.6% |
| Chippewa | 0.0 /100 | #291 | Tragic 20.6% |
| Immigrants | Latin America | 0.0 /100 | #292 | Tragic 20.6% |
| Immigrants | Grenada | 0.0 /100 | #293 | Tragic 20.7% |
| Immigrants | Senegal | 0.0 /100 | #294 | Tragic 20.7% |
| Immigrants | Caribbean | 0.0 /100 | #295 | Tragic 20.7% |
| Immigrants | West Indies | 0.0 /100 | #296 | Tragic 20.7% |
| Inupiat | 0.0 /100 | #297 | Tragic 20.8% |
| Mexicans | 0.0 /100 | #298 | Tragic 20.9% |
| Hispanics or Latinos | 0.0 /100 | #299 | Tragic 21.0% |
Demographics Similar to Hopi by Child Poverty Among Girls Under 16
In terms of child poverty among girls under 16, the demographic groups most similar to Hopi are Pima (28.2%, a difference of 1.3%), Yuman (27.1%, a difference of 2.9%), Crow (26.4%, a difference of 5.7%), Immigrants from Yemen (29.5%, a difference of 5.9%), and Cheyenne (26.3%, a difference of 6.0%).
| Demographics | Rating | Rank | Child Poverty Among Girls Under 16 |
| Blacks/African Americans | 0.0 /100 | #333 | Tragic 24.7% |
| Menominee | 0.0 /100 | #334 | Tragic 25.0% |
| Pueblo | 0.0 /100 | #335 | Tragic 25.2% |
| Sioux | 0.0 /100 | #336 | Tragic 25.6% |
| Yup'ik | 0.0 /100 | #337 | Tragic 25.8% |
| Cheyenne | 0.0 /100 | #338 | Tragic 26.3% |
| Crow | 0.0 /100 | #339 | Tragic 26.4% |
| Yuman | 0.0 /100 | #340 | Tragic 27.1% |
| Hopi | 0.0 /100 | #341 | Tragic 27.9% |
| Pima | 0.0 /100 | #342 | Tragic 28.2% |
| Immigrants | Yemen | 0.0 /100 | #343 | Tragic 29.5% |
| Navajo | 0.0 /100 | #344 | Tragic 30.5% |
| Lumbee | 0.0 /100 | #345 | Tragic 30.7% |
| Tohono O'odham | 0.0 /100 | #346 | Tragic 31.6% |
| Puerto Ricans | 0.0 /100 | #347 | Tragic 32.7% |