Immigrants from Latin America vs Immigrants from Ethiopia Child Poverty Among Girls Under 16
COMPARE
Immigrants from Latin America
Immigrants from Ethiopia
Child Poverty Among Girls Under 16
Child Poverty Among Girls Under 16 Comparison
Immigrants from Latin America
Immigrants from Ethiopia
20.6%
CHILD POVERTY AMONG GIRLS UNDER 16
0.0/ 100
METRIC RATING
292nd/ 347
METRIC RANK
16.6%
CHILD POVERTY AMONG GIRLS UNDER 16
43.1/ 100
METRIC RATING
182nd/ 347
METRIC RANK
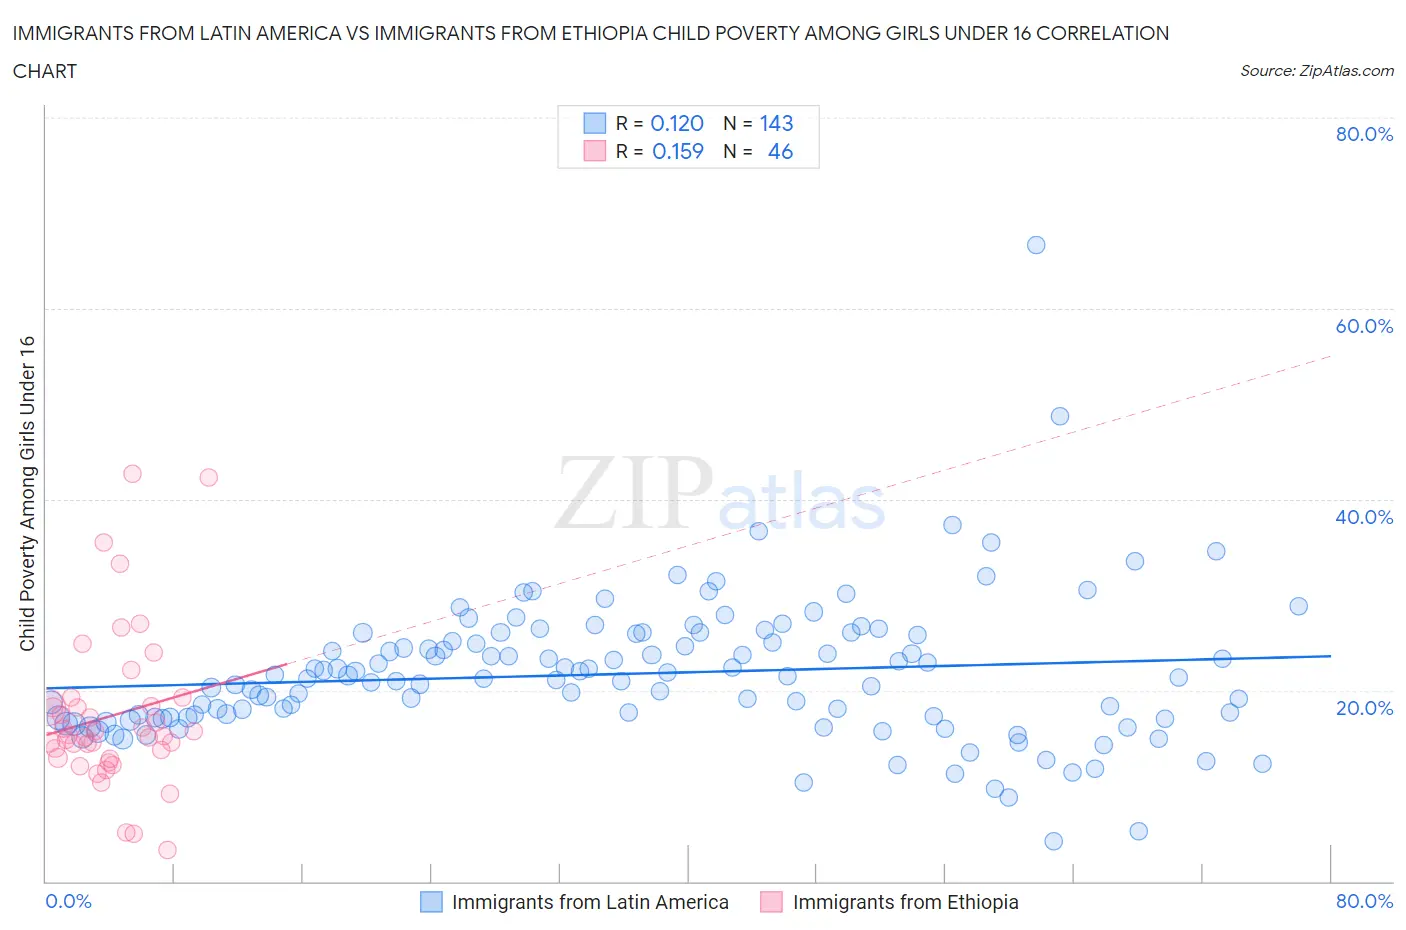
Immigrants from Latin America vs Immigrants from Ethiopia Child Poverty Among Girls Under 16 Correlation Chart
The statistical analysis conducted on geographies consisting of 539,700,311 people shows a poor positive correlation between the proportion of Immigrants from Latin America and poverty level among girls under the age of 16 in the United States with a correlation coefficient (R) of 0.120 and weighted average of 20.6%. Similarly, the statistical analysis conducted on geographies consisting of 209,782,942 people shows a poor positive correlation between the proportion of Immigrants from Ethiopia and poverty level among girls under the age of 16 in the United States with a correlation coefficient (R) of 0.159 and weighted average of 16.6%, a difference of 24.4%.
Child Poverty Among Girls Under 16 Correlation Summary
| Measurement | Immigrants from Latin America | Immigrants from Ethiopia |
| Minimum | 4.2% | 3.2% |
| Maximum | 66.7% | 42.7% |
| Range | 62.5% | 39.5% |
| Mean | 21.7% | 17.4% |
| Median | 21.2% | 15.3% |
| Interquartile 25% (IQ1) | 17.2% | 12.9% |
| Interquartile 75% (IQ3) | 25.9% | 18.4% |
| Interquartile Range (IQR) | 8.7% | 5.5% |
| Standard Deviation (Sample) | 7.5% | 8.2% |
| Standard Deviation (Population) | 7.5% | 8.2% |
Similar Demographics by Child Poverty Among Girls Under 16
Demographics Similar to Immigrants from Latin America by Child Poverty Among Girls Under 16
In terms of child poverty among girls under 16, the demographic groups most similar to Immigrants from Latin America are Immigrants from Grenada (20.7%, a difference of 0.040%), Chippewa (20.6%, a difference of 0.070%), Immigrants from Senegal (20.7%, a difference of 0.15%), Immigrants from Caribbean (20.7%, a difference of 0.19%), and Immigrants from Haiti (20.6%, a difference of 0.20%).
| Demographics | Rating | Rank | Child Poverty Among Girls Under 16 |
| Immigrants | Cabo Verde | 0.0 /100 | #285 | Tragic 20.3% |
| Iroquois | 0.0 /100 | #286 | Tragic 20.4% |
| Blackfeet | 0.0 /100 | #287 | Tragic 20.5% |
| Haitians | 0.0 /100 | #288 | Tragic 20.5% |
| Immigrants | Belize | 0.0 /100 | #289 | Tragic 20.6% |
| Immigrants | Haiti | 0.0 /100 | #290 | Tragic 20.6% |
| Chippewa | 0.0 /100 | #291 | Tragic 20.6% |
| Immigrants | Latin America | 0.0 /100 | #292 | Tragic 20.6% |
| Immigrants | Grenada | 0.0 /100 | #293 | Tragic 20.7% |
| Immigrants | Senegal | 0.0 /100 | #294 | Tragic 20.7% |
| Immigrants | Caribbean | 0.0 /100 | #295 | Tragic 20.7% |
| Immigrants | West Indies | 0.0 /100 | #296 | Tragic 20.7% |
| Inupiat | 0.0 /100 | #297 | Tragic 20.8% |
| Mexicans | 0.0 /100 | #298 | Tragic 20.9% |
| Hispanics or Latinos | 0.0 /100 | #299 | Tragic 21.0% |
Demographics Similar to Immigrants from Ethiopia by Child Poverty Among Girls Under 16
In terms of child poverty among girls under 16, the demographic groups most similar to Immigrants from Ethiopia are Immigrants from Iraq (16.6%, a difference of 0.010%), Immigrants from Syria (16.6%, a difference of 0.030%), Hawaiian (16.6%, a difference of 0.040%), White/Caucasian (16.6%, a difference of 0.070%), and Immigrants from Portugal (16.6%, a difference of 0.070%).
| Demographics | Rating | Rank | Child Poverty Among Girls Under 16 |
| Lebanese | 45.4 /100 | #175 | Average 16.6% |
| Hungarians | 45.1 /100 | #176 | Average 16.6% |
| Immigrants | Western Asia | 44.1 /100 | #177 | Average 16.6% |
| Whites/Caucasians | 43.6 /100 | #178 | Average 16.6% |
| Hawaiians | 43.4 /100 | #179 | Average 16.6% |
| Immigrants | Syria | 43.3 /100 | #180 | Average 16.6% |
| Immigrants | Iraq | 43.2 /100 | #181 | Average 16.6% |
| Immigrants | Ethiopia | 43.1 /100 | #182 | Average 16.6% |
| Immigrants | Portugal | 42.5 /100 | #183 | Average 16.6% |
| Scotch-Irish | 39.6 /100 | #184 | Fair 16.7% |
| Immigrants | Uruguay | 35.6 /100 | #185 | Fair 16.7% |
| South American Indians | 35.0 /100 | #186 | Fair 16.8% |
| Immigrants | Morocco | 34.6 /100 | #187 | Fair 16.8% |
| Arabs | 34.5 /100 | #188 | Fair 16.8% |
| Immigrants | Bosnia and Herzegovina | 32.5 /100 | #189 | Fair 16.8% |