Immigrants from Korea vs Immigrants from Cuba Receiving Food Stamps
COMPARE
Immigrants from Korea
Immigrants from Cuba
Receiving Food Stamps
Receiving Food Stamps Comparison
Immigrants from Korea
Immigrants from Cuba
8.7%
RECEIVING FOOD STAMPS
99.9/ 100
METRIC RATING
9th/ 347
METRIC RANK
20.8%
RECEIVING FOOD STAMPS
0.0/ 100
METRIC RATING
335th/ 347
METRIC RANK
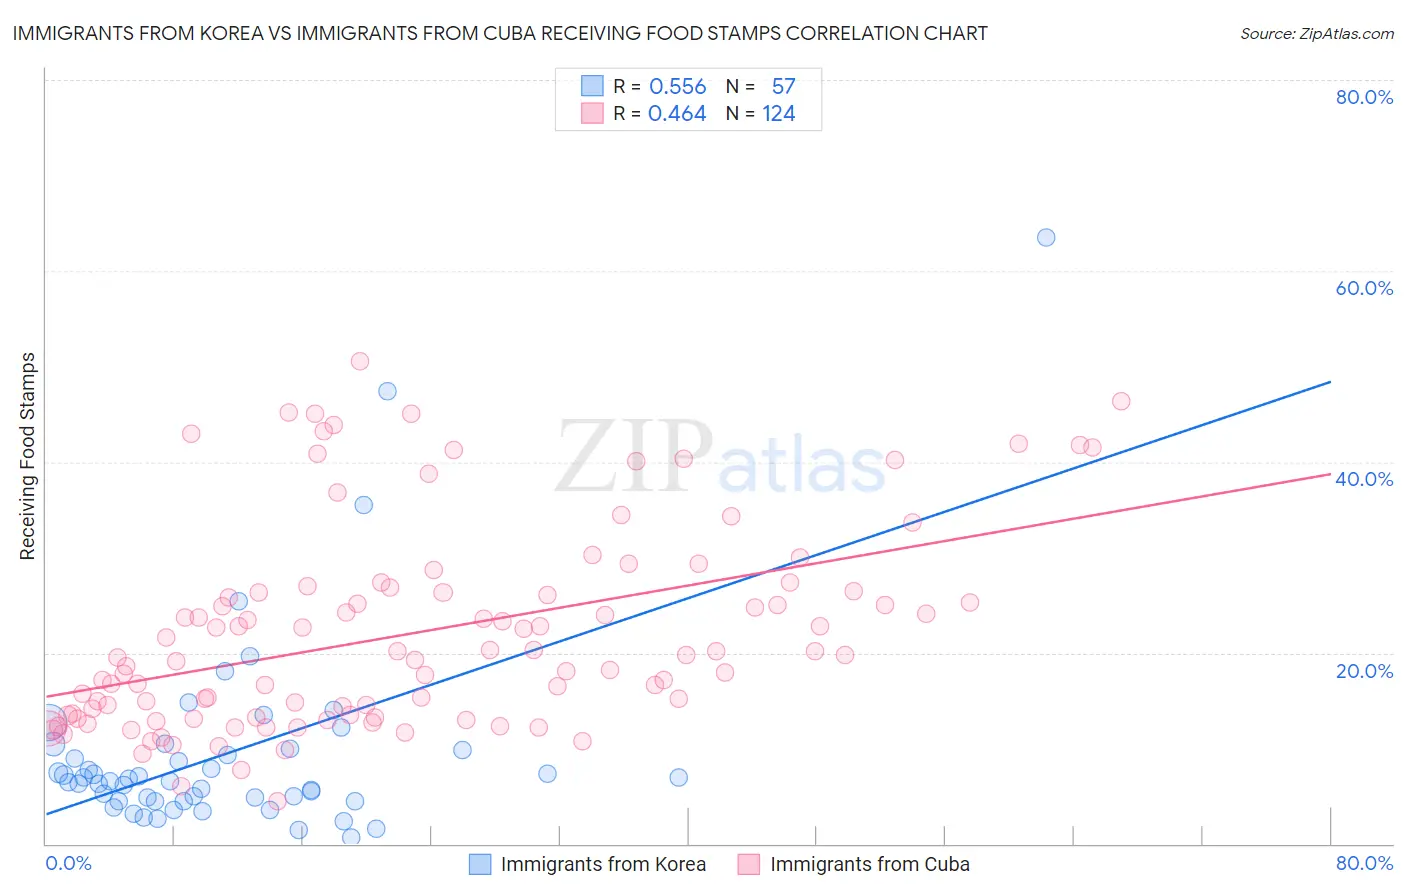
Immigrants from Korea vs Immigrants from Cuba Receiving Food Stamps Correlation Chart
The statistical analysis conducted on geographies consisting of 414,765,155 people shows a substantial positive correlation between the proportion of Immigrants from Korea and percentage of population receiving government assistance and/or food stamps in the United States with a correlation coefficient (R) of 0.556 and weighted average of 8.7%. Similarly, the statistical analysis conducted on geographies consisting of 325,340,789 people shows a moderate positive correlation between the proportion of Immigrants from Cuba and percentage of population receiving government assistance and/or food stamps in the United States with a correlation coefficient (R) of 0.464 and weighted average of 20.8%, a difference of 140.3%.
Receiving Food Stamps Correlation Summary
| Measurement | Immigrants from Korea | Immigrants from Cuba |
| Minimum | 0.70% | 4.5% |
| Maximum | 63.5% | 50.6% |
| Range | 62.8% | 46.1% |
| Mean | 9.5% | 22.1% |
| Median | 6.6% | 19.8% |
| Interquartile 25% (IQ1) | 4.5% | 13.5% |
| Interquartile 75% (IQ3) | 9.9% | 26.4% |
| Interquartile Range (IQR) | 5.4% | 12.9% |
| Standard Deviation (Sample) | 10.7% | 10.5% |
| Standard Deviation (Population) | 10.6% | 10.4% |
Similar Demographics by Receiving Food Stamps
Demographics Similar to Immigrants from Korea by Receiving Food Stamps
In terms of receiving food stamps, the demographic groups most similar to Immigrants from Korea are Burmese (8.6%, a difference of 0.16%), Immigrants from South Central Asia (8.8%, a difference of 1.9%), Okinawan (8.9%, a difference of 2.4%), Cypriot (8.9%, a difference of 2.4%), and Bulgarian (8.9%, a difference of 2.6%).
| Demographics | Rating | Rank | Receiving Food Stamps |
| Immigrants | India | 100.0 /100 | #2 | Exceptional 7.4% |
| Filipinos | 100.0 /100 | #3 | Exceptional 7.4% |
| Iranians | 100.0 /100 | #4 | Exceptional 7.9% |
| Thais | 100.0 /100 | #5 | Exceptional 8.1% |
| Immigrants | Singapore | 100.0 /100 | #6 | Exceptional 8.3% |
| Immigrants | Iran | 100.0 /100 | #7 | Exceptional 8.3% |
| Burmese | 99.9 /100 | #8 | Exceptional 8.6% |
| Immigrants | Korea | 99.9 /100 | #9 | Exceptional 8.7% |
| Immigrants | South Central Asia | 99.9 /100 | #10 | Exceptional 8.8% |
| Okinawans | 99.9 /100 | #11 | Exceptional 8.9% |
| Cypriots | 99.9 /100 | #12 | Exceptional 8.9% |
| Bulgarians | 99.9 /100 | #13 | Exceptional 8.9% |
| Maltese | 99.9 /100 | #14 | Exceptional 8.9% |
| Norwegians | 99.9 /100 | #15 | Exceptional 9.0% |
| Immigrants | Japan | 99.9 /100 | #16 | Exceptional 9.0% |
Demographics Similar to Immigrants from Cuba by Receiving Food Stamps
In terms of receiving food stamps, the demographic groups most similar to Immigrants from Cuba are Navajo (21.1%, a difference of 1.1%), Cape Verdean (21.1%, a difference of 1.2%), Dominican (21.4%, a difference of 2.6%), Yakama (21.4%, a difference of 2.9%), and Yuman (20.2%, a difference of 2.9%).
| Demographics | Rating | Rank | Receiving Food Stamps |
| Colville | 0.0 /100 | #328 | Tragic 18.3% |
| Immigrants | Dominica | 0.0 /100 | #329 | Tragic 18.4% |
| Pima | 0.0 /100 | #330 | Tragic 19.0% |
| Immigrants | Caribbean | 0.0 /100 | #331 | Tragic 19.6% |
| Pueblo | 0.0 /100 | #332 | Tragic 19.9% |
| Inupiat | 0.0 /100 | #333 | Tragic 20.1% |
| Yuman | 0.0 /100 | #334 | Tragic 20.2% |
| Immigrants | Cuba | 0.0 /100 | #335 | Tragic 20.8% |
| Navajo | 0.0 /100 | #336 | Tragic 21.1% |
| Cape Verdeans | 0.0 /100 | #337 | Tragic 21.1% |
| Dominicans | 0.0 /100 | #338 | Tragic 21.4% |
| Yakama | 0.0 /100 | #339 | Tragic 21.4% |
| Tohono O'odham | 0.0 /100 | #340 | Tragic 21.5% |
| Hopi | 0.0 /100 | #341 | Tragic 21.6% |
| Immigrants | Yemen | 0.0 /100 | #342 | Tragic 21.6% |