Spaniard vs Venezuelan Poverty
COMPARE
Spaniard
Venezuelan
Poverty
Poverty Comparison
Spaniards
Venezuelans
12.8%
POVERTY
16.5/ 100
METRIC RATING
200th/ 347
METRIC RANK
12.2%
POVERTY
56.9/ 100
METRIC RATING
166th/ 347
METRIC RANK
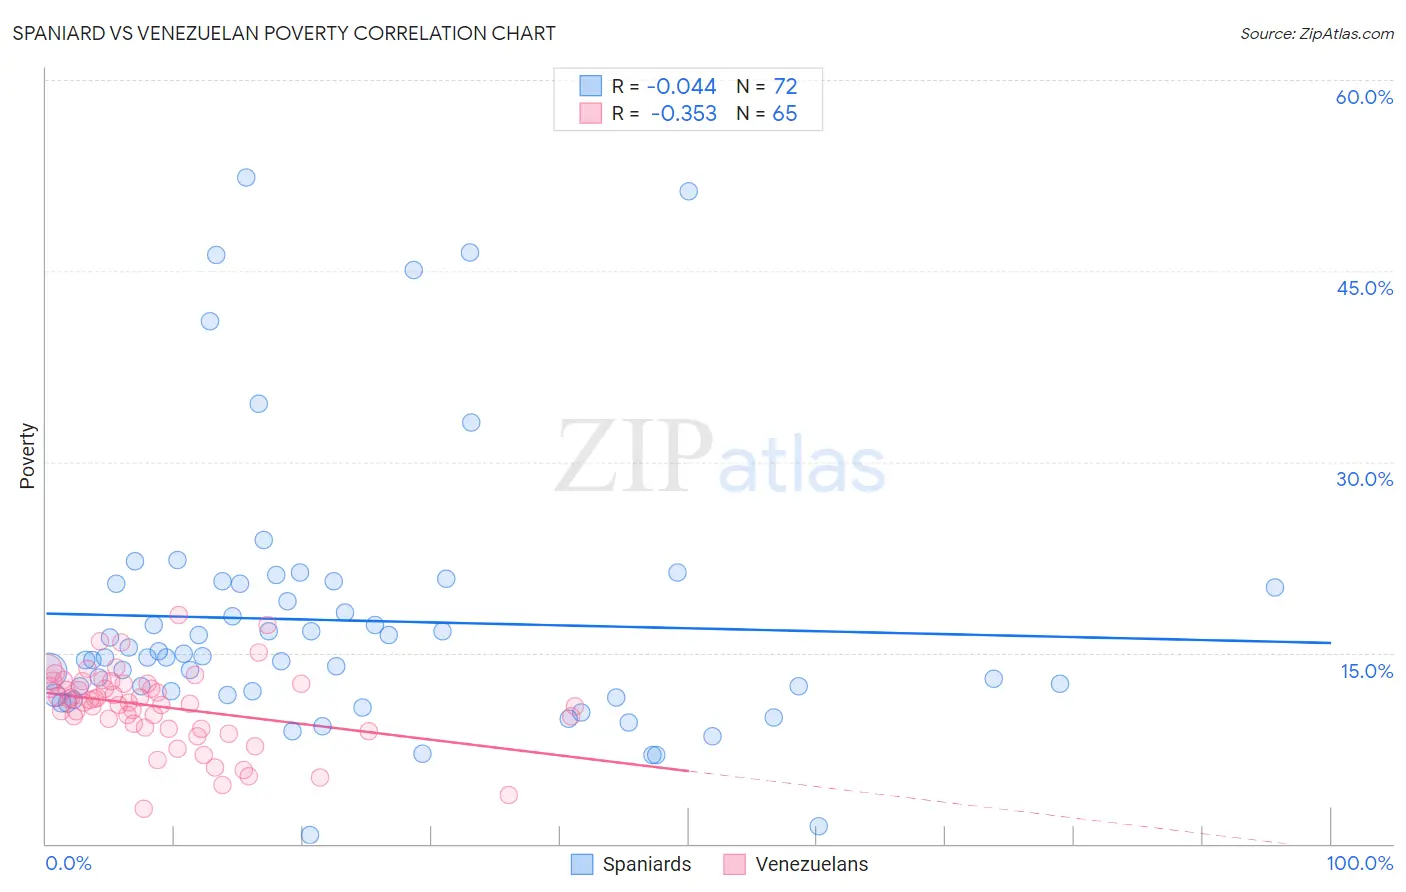
Spaniard vs Venezuelan Poverty Correlation Chart
The statistical analysis conducted on geographies consisting of 443,194,534 people shows no correlation between the proportion of Spaniards and poverty level in the United States with a correlation coefficient (R) of -0.044 and weighted average of 12.8%. Similarly, the statistical analysis conducted on geographies consisting of 306,018,629 people shows a mild negative correlation between the proportion of Venezuelans and poverty level in the United States with a correlation coefficient (R) of -0.353 and weighted average of 12.2%, a difference of 4.6%.
Poverty Correlation Summary
| Measurement | Spaniard | Venezuelan |
| Minimum | 0.64% | 2.7% |
| Maximum | 52.4% | 17.9% |
| Range | 51.7% | 15.2% |
| Mean | 17.5% | 10.7% |
| Median | 14.7% | 11.1% |
| Interquartile 25% (IQ1) | 11.7% | 9.1% |
| Interquartile 75% (IQ3) | 20.5% | 12.6% |
| Interquartile Range (IQR) | 8.8% | 3.5% |
| Standard Deviation (Sample) | 10.6% | 3.0% |
| Standard Deviation (Population) | 10.5% | 3.0% |
Similar Demographics by Poverty
Demographics Similar to Spaniards by Poverty
In terms of poverty, the demographic groups most similar to Spaniards are Immigrants from Uganda (12.8%, a difference of 0.0%), Immigrants from Kenya (12.8%, a difference of 0.16%), Immigrants from Uruguay (12.8%, a difference of 0.16%), Hmong (12.8%, a difference of 0.27%), and Immigrants from Lebanon (12.8%, a difference of 0.35%).
| Demographics | Rating | Rank | Poverty |
| Delaware | 21.4 /100 | #193 | Fair 12.7% |
| Arabs | 21.1 /100 | #194 | Fair 12.7% |
| Immigrants | Kuwait | 20.9 /100 | #195 | Fair 12.7% |
| Iraqis | 20.8 /100 | #196 | Fair 12.7% |
| Immigrants | Lebanon | 18.7 /100 | #197 | Poor 12.8% |
| Spanish | 18.7 /100 | #198 | Poor 12.8% |
| Immigrants | Kenya | 17.5 /100 | #199 | Poor 12.8% |
| Spaniards | 16.5 /100 | #200 | Poor 12.8% |
| Immigrants | Uganda | 16.5 /100 | #201 | Poor 12.8% |
| Immigrants | Uruguay | 15.6 /100 | #202 | Poor 12.8% |
| Hmong | 15.0 /100 | #203 | Poor 12.8% |
| Immigrants | Western Asia | 14.1 /100 | #204 | Poor 12.9% |
| Tsimshian | 9.2 /100 | #205 | Tragic 13.0% |
| Immigrants | Eastern Africa | 7.0 /100 | #206 | Tragic 13.1% |
| Panamanians | 6.6 /100 | #207 | Tragic 13.1% |
Demographics Similar to Venezuelans by Poverty
In terms of poverty, the demographic groups most similar to Venezuelans are Immigrants from Chile (12.2%, a difference of 0.020%), Immigrants from Venezuela (12.2%, a difference of 0.040%), Immigrants from Albania (12.2%, a difference of 0.090%), Colombian (12.2%, a difference of 0.10%), and White/Caucasian (12.3%, a difference of 0.15%).
| Demographics | Rating | Rank | Poverty |
| Pennsylvania Germans | 60.8 /100 | #159 | Good 12.2% |
| Immigrants | Nepal | 60.4 /100 | #160 | Good 12.2% |
| Immigrants | Fiji | 59.1 /100 | #161 | Average 12.2% |
| Ethiopians | 59.1 /100 | #162 | Average 12.2% |
| Immigrants | Ethiopia | 58.6 /100 | #163 | Average 12.2% |
| Colombians | 57.8 /100 | #164 | Average 12.2% |
| Immigrants | Albania | 57.7 /100 | #165 | Average 12.2% |
| Venezuelans | 56.9 /100 | #166 | Average 12.2% |
| Immigrants | Chile | 56.7 /100 | #167 | Average 12.2% |
| Immigrants | Venezuela | 56.5 /100 | #168 | Average 12.2% |
| Whites/Caucasians | 55.4 /100 | #169 | Average 12.3% |
| Immigrants | Oceania | 54.6 /100 | #170 | Average 12.3% |
| Immigrants | Spain | 51.3 /100 | #171 | Average 12.3% |
| Immigrants | Portugal | 50.5 /100 | #172 | Average 12.3% |
| Celtics | 50.1 /100 | #173 | Average 12.3% |