Immigrants from Korea vs Iranian Householder Income Ages 25 - 44 years
COMPARE
Immigrants from Korea
Iranian
Householder Income Ages 25 - 44 years
Householder Income Ages 25 - 44 years Comparison
Immigrants from Korea
Iranians
$113,401
HOUSEHOLDER INCOME AGES 25 - 44 YEARS
100.0/ 100
METRIC RATING
20th/ 347
METRIC RANK
$120,292
HOUSEHOLDER INCOME AGES 25 - 44 YEARS
100.0/ 100
METRIC RATING
8th/ 347
METRIC RANK
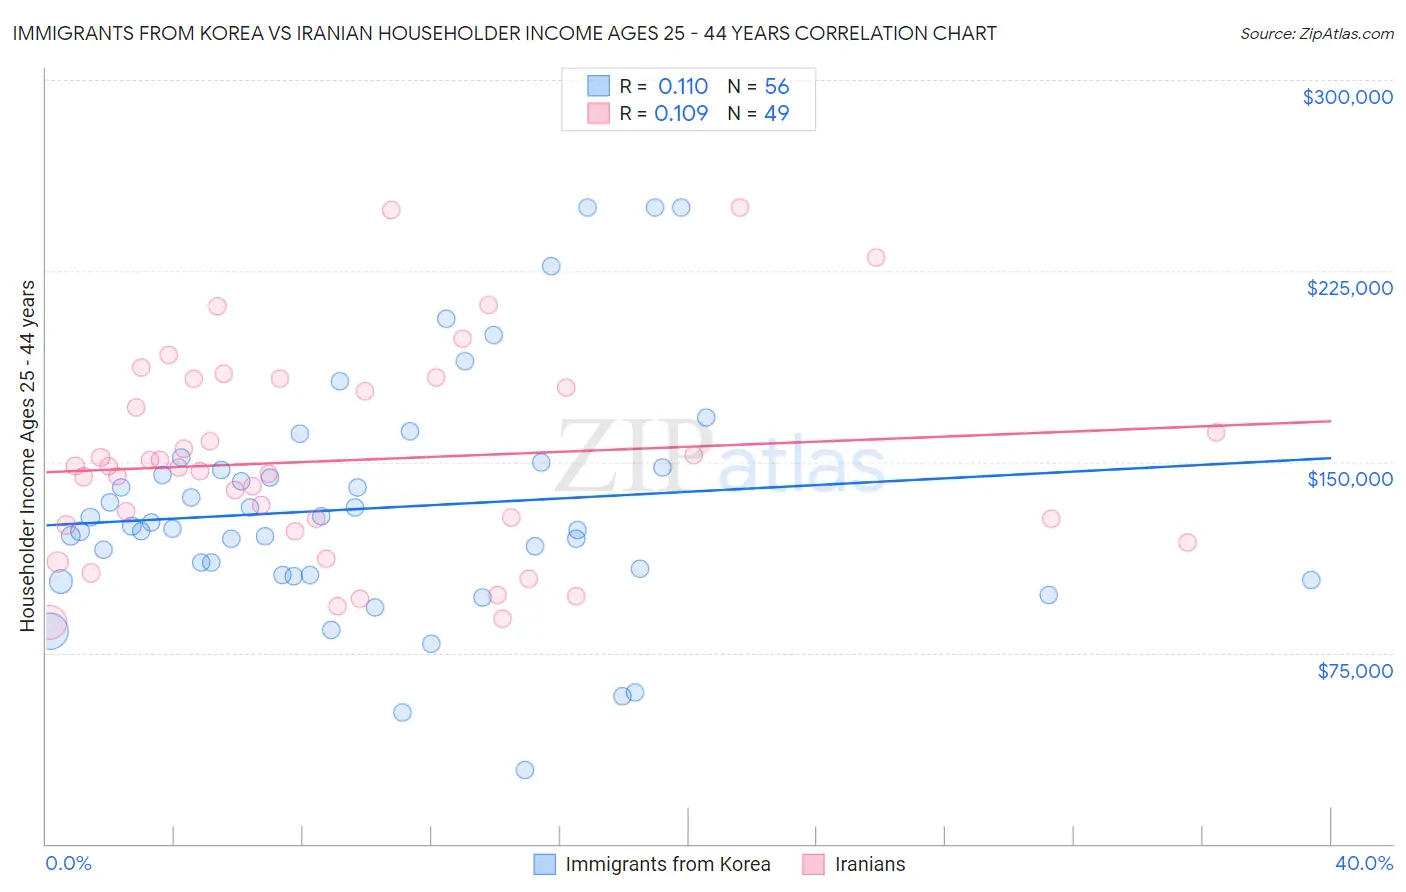
Immigrants from Korea vs Iranian Householder Income Ages 25 - 44 years Correlation Chart
The statistical analysis conducted on geographies consisting of 415,166,266 people shows a poor positive correlation between the proportion of Immigrants from Korea and household income with householder between the ages 25 and 44 in the United States with a correlation coefficient (R) of 0.110 and weighted average of $113,401. Similarly, the statistical analysis conducted on geographies consisting of 316,256,370 people shows a poor positive correlation between the proportion of Iranians and household income with householder between the ages 25 and 44 in the United States with a correlation coefficient (R) of 0.109 and weighted average of $120,292, a difference of 6.1%.
Householder Income Ages 25 - 44 years Correlation Summary
| Measurement | Immigrants from Korea | Iranian |
| Minimum | $29,000 | $87,093 |
| Maximum | $250,001 | $250,001 |
| Range | $221,001 | $162,908 |
| Mean | $131,830 | $150,667 |
| Median | $124,193 | $147,708 |
| Interquartile 25% (IQ1) | $105,598 | $124,074 |
| Interquartile 75% (IQ3) | $147,331 | $181,001 |
| Interquartile Range (IQR) | $41,733 | $56,927 |
| Standard Deviation (Sample) | $46,184 | $40,122 |
| Standard Deviation (Population) | $45,770 | $39,710 |
Demographics Similar to Immigrants from Korea and Iranians by Householder Income Ages 25 - 44 years
In terms of householder income ages 25 - 44 years, the demographic groups most similar to Immigrants from Korea are Burmese ($113,701, a difference of 0.26%), Asian ($112,666, a difference of 0.65%), Immigrants from Belgium ($112,575, a difference of 0.73%), Eastern European ($114,523, a difference of 0.99%), and Immigrants from Japan ($112,228, a difference of 1.1%). Similarly, the demographic groups most similar to Iranians are Immigrants from Ireland ($120,333, a difference of 0.030%), Immigrants from China ($119,756, a difference of 0.45%), Indian (Asian) ($119,496, a difference of 0.67%), Okinawan ($119,349, a difference of 0.79%), and Immigrants from Iran ($119,204, a difference of 0.91%).
| Demographics | Rating | Rank | Householder Income Ages 25 - 44 years |
| Immigrants | Singapore | 100.0 /100 | #4 | Exceptional $124,429 |
| Immigrants | India | 100.0 /100 | #5 | Exceptional $124,238 |
| Thais | 100.0 /100 | #6 | Exceptional $121,778 |
| Immigrants | Ireland | 100.0 /100 | #7 | Exceptional $120,333 |
| Iranians | 100.0 /100 | #8 | Exceptional $120,292 |
| Immigrants | China | 100.0 /100 | #9 | Exceptional $119,756 |
| Indians (Asian) | 100.0 /100 | #10 | Exceptional $119,496 |
| Okinawans | 100.0 /100 | #11 | Exceptional $119,349 |
| Immigrants | Iran | 100.0 /100 | #12 | Exceptional $119,204 |
| Immigrants | Eastern Asia | 100.0 /100 | #13 | Exceptional $118,056 |
| Immigrants | Israel | 100.0 /100 | #14 | Exceptional $117,219 |
| Immigrants | South Central Asia | 100.0 /100 | #15 | Exceptional $116,626 |
| Cypriots | 100.0 /100 | #16 | Exceptional $116,364 |
| Immigrants | Australia | 100.0 /100 | #17 | Exceptional $115,947 |
| Eastern Europeans | 100.0 /100 | #18 | Exceptional $114,523 |
| Burmese | 100.0 /100 | #19 | Exceptional $113,701 |
| Immigrants | Korea | 100.0 /100 | #20 | Exceptional $113,401 |
| Asians | 100.0 /100 | #21 | Exceptional $112,666 |
| Immigrants | Belgium | 100.0 /100 | #22 | Exceptional $112,575 |
| Immigrants | Japan | 100.0 /100 | #23 | Exceptional $112,228 |
| Immigrants | Sweden | 100.0 /100 | #24 | Exceptional $112,010 |