Immigrants from Iraq vs Immigrants from Zaire Male Poverty
COMPARE
Immigrants from Iraq
Immigrants from Zaire
Male Poverty
Male Poverty Comparison
Immigrants from Iraq
Immigrants from Zaire
11.4%
MALE POVERTY
31.9/ 100
METRIC RATING
187th/ 347
METRIC RANK
13.8%
MALE POVERTY
0.0/ 100
METRIC RATING
290th/ 347
METRIC RANK
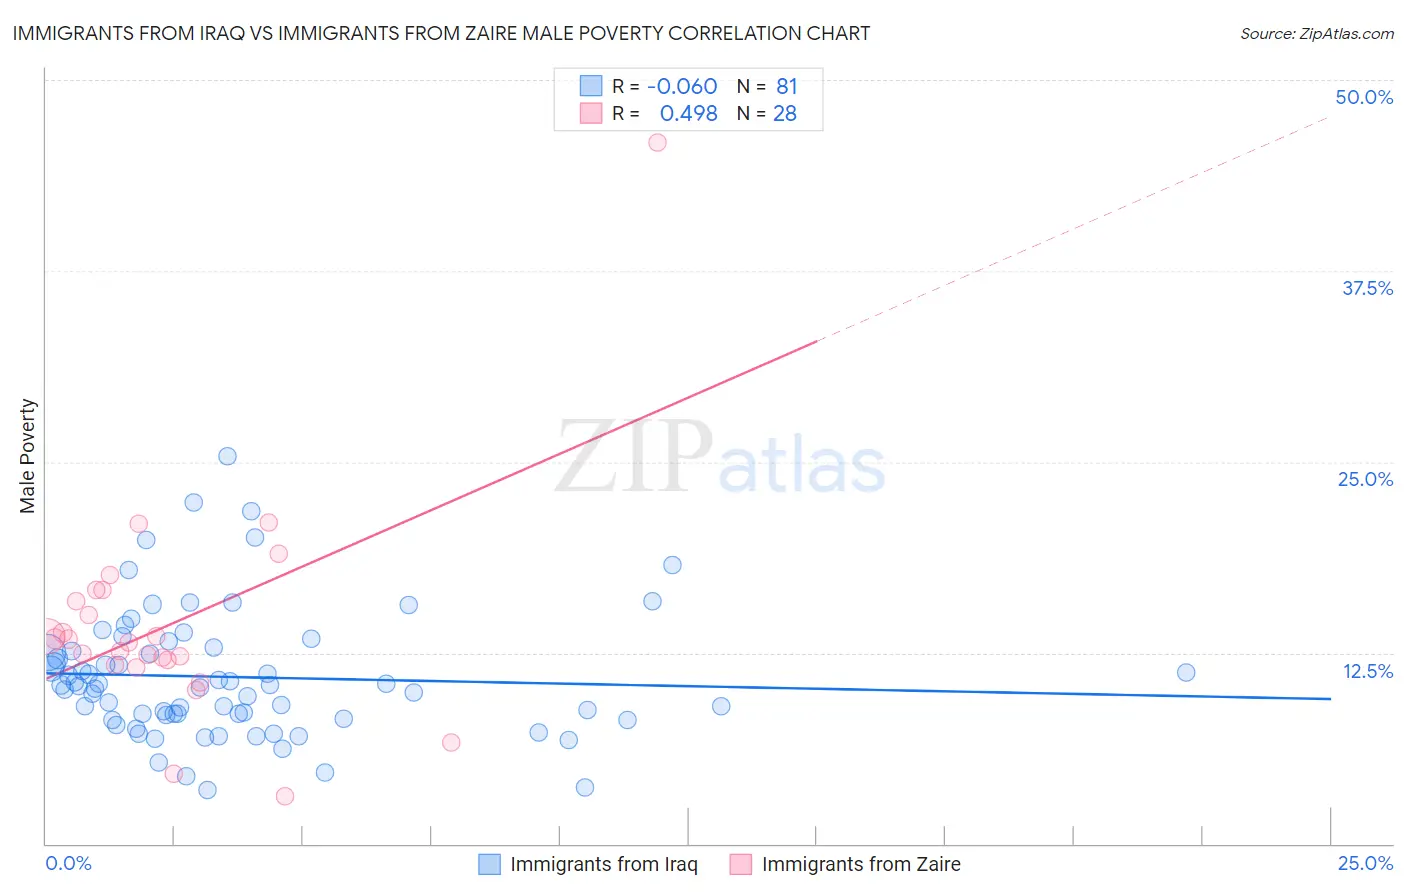
Immigrants from Iraq vs Immigrants from Zaire Male Poverty Correlation Chart
The statistical analysis conducted on geographies consisting of 194,696,024 people shows a slight negative correlation between the proportion of Immigrants from Iraq and poverty level among males in the United States with a correlation coefficient (R) of -0.060 and weighted average of 11.4%. Similarly, the statistical analysis conducted on geographies consisting of 107,236,252 people shows a moderate positive correlation between the proportion of Immigrants from Zaire and poverty level among males in the United States with a correlation coefficient (R) of 0.498 and weighted average of 13.8%, a difference of 21.2%.
Male Poverty Correlation Summary
| Measurement | Immigrants from Iraq | Immigrants from Zaire |
| Minimum | 3.5% | 3.1% |
| Maximum | 25.3% | 45.9% |
| Range | 21.9% | 42.8% |
| Mean | 10.9% | 14.3% |
| Median | 10.3% | 13.3% |
| Interquartile 25% (IQ1) | 8.3% | 11.9% |
| Interquartile 75% (IQ3) | 12.8% | 16.3% |
| Interquartile Range (IQR) | 4.5% | 4.4% |
| Standard Deviation (Sample) | 4.2% | 7.4% |
| Standard Deviation (Population) | 4.2% | 7.3% |
Similar Demographics by Male Poverty
Demographics Similar to Immigrants from Iraq by Male Poverty
In terms of male poverty, the demographic groups most similar to Immigrants from Iraq are Immigrants from Sierra Leone (11.4%, a difference of 0.11%), Immigrants from Afghanistan (11.4%, a difference of 0.16%), Sierra Leonean (11.4%, a difference of 0.22%), Hawaiian (11.4%, a difference of 0.41%), and Immigrants from South America (11.3%, a difference of 0.54%).
| Demographics | Rating | Rank | Male Poverty |
| Immigrants | Morocco | 40.1 /100 | #180 | Average 11.3% |
| Immigrants | Costa Rica | 39.5 /100 | #181 | Fair 11.3% |
| Mongolians | 39.0 /100 | #182 | Fair 11.3% |
| Kenyans | 38.4 /100 | #183 | Fair 11.3% |
| Immigrants | South America | 36.9 /100 | #184 | Fair 11.3% |
| Immigrants | Afghanistan | 33.3 /100 | #185 | Fair 11.4% |
| Immigrants | Sierra Leone | 32.9 /100 | #186 | Fair 11.4% |
| Immigrants | Iraq | 31.9 /100 | #187 | Fair 11.4% |
| Sierra Leoneans | 29.9 /100 | #188 | Fair 11.4% |
| Hawaiians | 28.3 /100 | #189 | Fair 11.4% |
| Israelis | 26.1 /100 | #190 | Fair 11.5% |
| South American Indians | 22.8 /100 | #191 | Fair 11.5% |
| Immigrants | Uruguay | 19.1 /100 | #192 | Poor 11.6% |
| Immigrants | Kuwait | 17.3 /100 | #193 | Poor 11.6% |
| Immigrants | Kenya | 16.1 /100 | #194 | Poor 11.6% |
Demographics Similar to Immigrants from Zaire by Male Poverty
In terms of male poverty, the demographic groups most similar to Immigrants from Zaire are Guatemalan (13.8%, a difference of 0.010%), Vietnamese (13.8%, a difference of 0.090%), Immigrants from St. Vincent and the Grenadines (13.8%, a difference of 0.18%), Indonesian (13.8%, a difference of 0.26%), and Immigrants from Belize (13.8%, a difference of 0.27%).
| Demographics | Rating | Rank | Male Poverty |
| Comanche | 0.0 /100 | #283 | Tragic 13.8% |
| Immigrants | Haiti | 0.0 /100 | #284 | Tragic 13.8% |
| West Indians | 0.0 /100 | #285 | Tragic 13.8% |
| Shoshone | 0.0 /100 | #286 | Tragic 13.8% |
| Immigrants | Barbados | 0.0 /100 | #287 | Tragic 13.8% |
| Immigrants | St. Vincent and the Grenadines | 0.0 /100 | #288 | Tragic 13.8% |
| Guatemalans | 0.0 /100 | #289 | Tragic 13.8% |
| Immigrants | Zaire | 0.0 /100 | #290 | Tragic 13.8% |
| Vietnamese | 0.0 /100 | #291 | Tragic 13.8% |
| Indonesians | 0.0 /100 | #292 | Tragic 13.8% |
| Immigrants | Belize | 0.0 /100 | #293 | Tragic 13.8% |
| Hispanics or Latinos | 0.0 /100 | #294 | Tragic 13.9% |
| Immigrants | Central America | 0.0 /100 | #295 | Tragic 13.9% |
| Cajuns | 0.0 /100 | #296 | Tragic 13.9% |
| Inupiat | 0.0 /100 | #297 | Tragic 14.0% |