Somali vs Belizean Poverty
COMPARE
Somali
Belizean
Poverty
Poverty Comparison
Somalis
Belizeans
15.4%
POVERTY
0.0/ 100
METRIC RATING
302nd/ 347
METRIC RANK
14.8%
POVERTY
0.0/ 100
METRIC RATING
278th/ 347
METRIC RANK
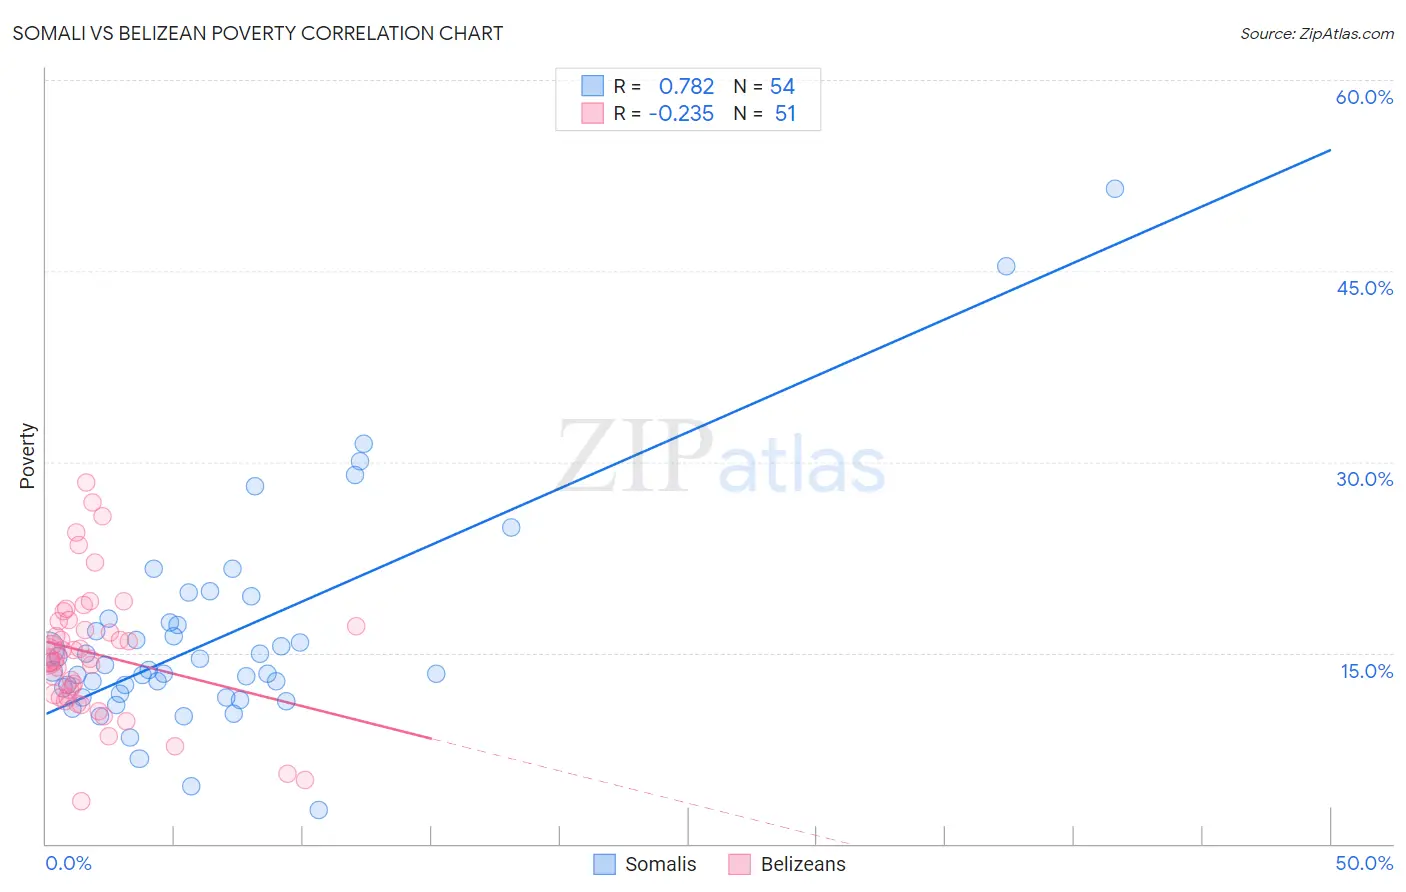
Somali vs Belizean Poverty Correlation Chart
The statistical analysis conducted on geographies consisting of 99,289,063 people shows a strong positive correlation between the proportion of Somalis and poverty level in the United States with a correlation coefficient (R) of 0.782 and weighted average of 15.4%. Similarly, the statistical analysis conducted on geographies consisting of 144,164,069 people shows a weak negative correlation between the proportion of Belizeans and poverty level in the United States with a correlation coefficient (R) of -0.235 and weighted average of 14.8%, a difference of 4.0%.
Poverty Correlation Summary
| Measurement | Somali | Belizean |
| Minimum | 2.7% | 3.4% |
| Maximum | 51.5% | 28.4% |
| Range | 48.8% | 25.0% |
| Mean | 16.2% | 14.9% |
| Median | 13.6% | 14.5% |
| Interquartile 25% (IQ1) | 11.8% | 11.5% |
| Interquartile 75% (IQ3) | 17.4% | 17.5% |
| Interquartile Range (IQR) | 5.6% | 6.0% |
| Standard Deviation (Sample) | 8.6% | 5.2% |
| Standard Deviation (Population) | 8.5% | 5.2% |
Similar Demographics by Poverty
Demographics Similar to Somalis by Poverty
In terms of poverty, the demographic groups most similar to Somalis are Bahamian (15.4%, a difference of 0.13%), Immigrants from Central America (15.4%, a difference of 0.34%), Immigrants from Caribbean (15.5%, a difference of 0.48%), Immigrants from Mexico (15.5%, a difference of 0.57%), and Immigrants from Guatemala (15.5%, a difference of 0.61%).
| Demographics | Rating | Rank | Poverty |
| Guatemalans | 0.0 /100 | #295 | Tragic 15.3% |
| Hispanics or Latinos | 0.0 /100 | #296 | Tragic 15.3% |
| Immigrants | Bangladesh | 0.0 /100 | #297 | Tragic 15.3% |
| Immigrants | Senegal | 0.0 /100 | #298 | Tragic 15.3% |
| Senegalese | 0.0 /100 | #299 | Tragic 15.3% |
| Immigrants | Central America | 0.0 /100 | #300 | Tragic 15.4% |
| Bahamians | 0.0 /100 | #301 | Tragic 15.4% |
| Somalis | 0.0 /100 | #302 | Tragic 15.4% |
| Immigrants | Caribbean | 0.0 /100 | #303 | Tragic 15.5% |
| Immigrants | Mexico | 0.0 /100 | #304 | Tragic 15.5% |
| Immigrants | Guatemala | 0.0 /100 | #305 | Tragic 15.5% |
| Creek | 0.0 /100 | #306 | Tragic 15.6% |
| Africans | 0.0 /100 | #307 | Tragic 15.6% |
| Choctaw | 0.0 /100 | #308 | Tragic 15.6% |
| Seminole | 0.0 /100 | #309 | Tragic 15.6% |
Demographics Similar to Belizeans by Poverty
In terms of poverty, the demographic groups most similar to Belizeans are Bangladeshi (14.8%, a difference of 0.020%), Immigrants from Bahamas (14.8%, a difference of 0.070%), Immigrants from West Indies (14.8%, a difference of 0.080%), Barbadian (14.8%, a difference of 0.11%), and Immigrants from St. Vincent and the Grenadines (14.9%, a difference of 0.29%).
| Demographics | Rating | Rank | Poverty |
| Shoshone | 0.0 /100 | #271 | Tragic 14.7% |
| Chickasaw | 0.0 /100 | #272 | Tragic 14.7% |
| Spanish Americans | 0.0 /100 | #273 | Tragic 14.7% |
| Barbadians | 0.0 /100 | #274 | Tragic 14.8% |
| Immigrants | West Indies | 0.0 /100 | #275 | Tragic 14.8% |
| Immigrants | Bahamas | 0.0 /100 | #276 | Tragic 14.8% |
| Bangladeshis | 0.0 /100 | #277 | Tragic 14.8% |
| Belizeans | 0.0 /100 | #278 | Tragic 14.8% |
| Immigrants | St. Vincent and the Grenadines | 0.0 /100 | #279 | Tragic 14.9% |
| Haitians | 0.0 /100 | #280 | Tragic 14.9% |
| Immigrants | Barbados | 0.0 /100 | #281 | Tragic 14.9% |
| Comanche | 0.0 /100 | #282 | Tragic 15.0% |
| Immigrants | Haiti | 0.0 /100 | #283 | Tragic 15.0% |
| West Indians | 0.0 /100 | #284 | Tragic 15.0% |
| Vietnamese | 0.0 /100 | #285 | Tragic 15.0% |