Immigrants from Eastern Europe vs Belizean Poverty
COMPARE
Immigrants from Eastern Europe
Belizean
Poverty
Poverty Comparison
Immigrants from Eastern Europe
Belizeans
11.3%
POVERTY
97.0/ 100
METRIC RATING
75th/ 347
METRIC RANK
14.8%
POVERTY
0.0/ 100
METRIC RATING
278th/ 347
METRIC RANK
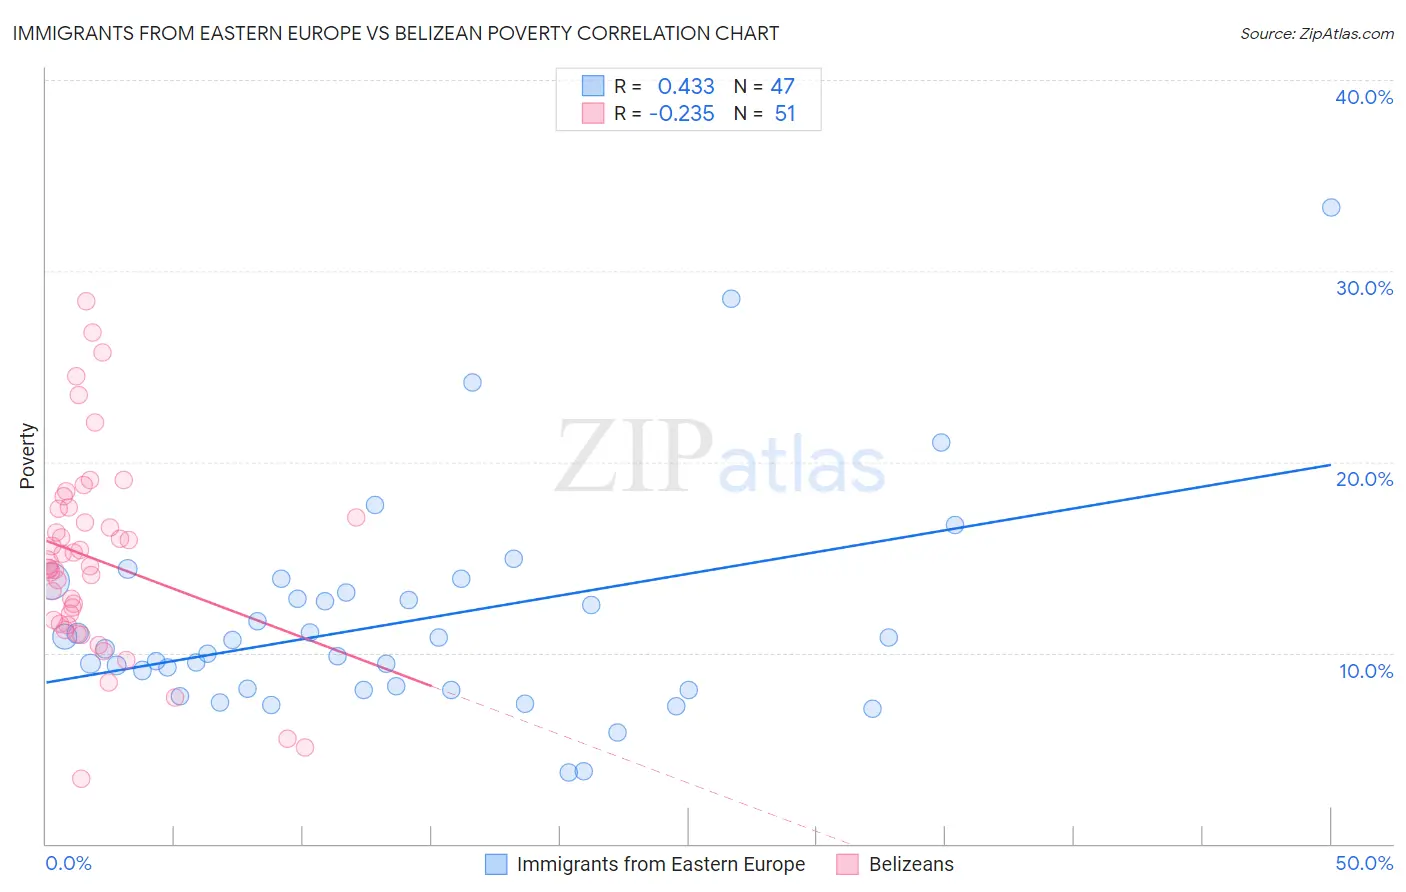
Immigrants from Eastern Europe vs Belizean Poverty Correlation Chart
The statistical analysis conducted on geographies consisting of 475,463,509 people shows a moderate positive correlation between the proportion of Immigrants from Eastern Europe and poverty level in the United States with a correlation coefficient (R) of 0.433 and weighted average of 11.3%. Similarly, the statistical analysis conducted on geographies consisting of 144,164,069 people shows a weak negative correlation between the proportion of Belizeans and poverty level in the United States with a correlation coefficient (R) of -0.235 and weighted average of 14.8%, a difference of 31.4%.
Poverty Correlation Summary
| Measurement | Immigrants from Eastern Europe | Belizean |
| Minimum | 3.8% | 3.4% |
| Maximum | 33.3% | 28.4% |
| Range | 29.6% | 25.0% |
| Mean | 11.6% | 14.9% |
| Median | 10.2% | 14.5% |
| Interquartile 25% (IQ1) | 8.1% | 11.5% |
| Interquartile 75% (IQ3) | 13.2% | 17.5% |
| Interquartile Range (IQR) | 5.1% | 6.0% |
| Standard Deviation (Sample) | 5.7% | 5.2% |
| Standard Deviation (Population) | 5.6% | 5.2% |
Similar Demographics by Poverty
Demographics Similar to Immigrants from Eastern Europe by Poverty
In terms of poverty, the demographic groups most similar to Immigrants from Eastern Europe are Immigrants from North America (11.3%, a difference of 0.15%), Carpatho Rusyn (11.3%, a difference of 0.19%), Immigrants from Eastern Asia (11.3%, a difference of 0.22%), European (11.3%, a difference of 0.24%), and Immigrants from Belgium (11.3%, a difference of 0.24%).
| Demographics | Rating | Rank | Poverty |
| Slovaks | 97.4 /100 | #68 | Exceptional 11.2% |
| Serbians | 97.4 /100 | #69 | Exceptional 11.2% |
| Immigrants | Canada | 97.3 /100 | #70 | Exceptional 11.3% |
| Zimbabweans | 97.3 /100 | #71 | Exceptional 11.3% |
| Europeans | 97.2 /100 | #72 | Exceptional 11.3% |
| Immigrants | Belgium | 97.2 /100 | #73 | Exceptional 11.3% |
| Carpatho Rusyns | 97.2 /100 | #74 | Exceptional 11.3% |
| Immigrants | Eastern Europe | 97.0 /100 | #75 | Exceptional 11.3% |
| Immigrants | North America | 96.8 /100 | #76 | Exceptional 11.3% |
| Immigrants | Eastern Asia | 96.7 /100 | #77 | Exceptional 11.3% |
| Dutch | 96.7 /100 | #78 | Exceptional 11.3% |
| Cambodians | 96.7 /100 | #79 | Exceptional 11.3% |
| Indians (Asian) | 96.6 /100 | #80 | Exceptional 11.3% |
| Irish | 96.6 /100 | #81 | Exceptional 11.3% |
| Egyptians | 96.5 /100 | #82 | Exceptional 11.3% |
Demographics Similar to Belizeans by Poverty
In terms of poverty, the demographic groups most similar to Belizeans are Bangladeshi (14.8%, a difference of 0.020%), Immigrants from Bahamas (14.8%, a difference of 0.070%), Immigrants from West Indies (14.8%, a difference of 0.080%), Barbadian (14.8%, a difference of 0.11%), and Immigrants from St. Vincent and the Grenadines (14.9%, a difference of 0.29%).
| Demographics | Rating | Rank | Poverty |
| Shoshone | 0.0 /100 | #271 | Tragic 14.7% |
| Chickasaw | 0.0 /100 | #272 | Tragic 14.7% |
| Spanish Americans | 0.0 /100 | #273 | Tragic 14.7% |
| Barbadians | 0.0 /100 | #274 | Tragic 14.8% |
| Immigrants | West Indies | 0.0 /100 | #275 | Tragic 14.8% |
| Immigrants | Bahamas | 0.0 /100 | #276 | Tragic 14.8% |
| Bangladeshis | 0.0 /100 | #277 | Tragic 14.8% |
| Belizeans | 0.0 /100 | #278 | Tragic 14.8% |
| Immigrants | St. Vincent and the Grenadines | 0.0 /100 | #279 | Tragic 14.9% |
| Haitians | 0.0 /100 | #280 | Tragic 14.9% |
| Immigrants | Barbados | 0.0 /100 | #281 | Tragic 14.9% |
| Comanche | 0.0 /100 | #282 | Tragic 15.0% |
| Immigrants | Haiti | 0.0 /100 | #283 | Tragic 15.0% |
| West Indians | 0.0 /100 | #284 | Tragic 15.0% |
| Vietnamese | 0.0 /100 | #285 | Tragic 15.0% |