Immigrants from Guyana vs Alaska Native Master's Degree
COMPARE
Immigrants from Guyana
Alaska Native
Master's Degree
Master's Degree Comparison
Immigrants from Guyana
Alaska Natives
13.4%
MASTER'S DEGREE
4.4/ 100
METRIC RATING
236th/ 347
METRIC RANK
11.6%
MASTER'S DEGREE
0.1/ 100
METRIC RATING
293rd/ 347
METRIC RANK
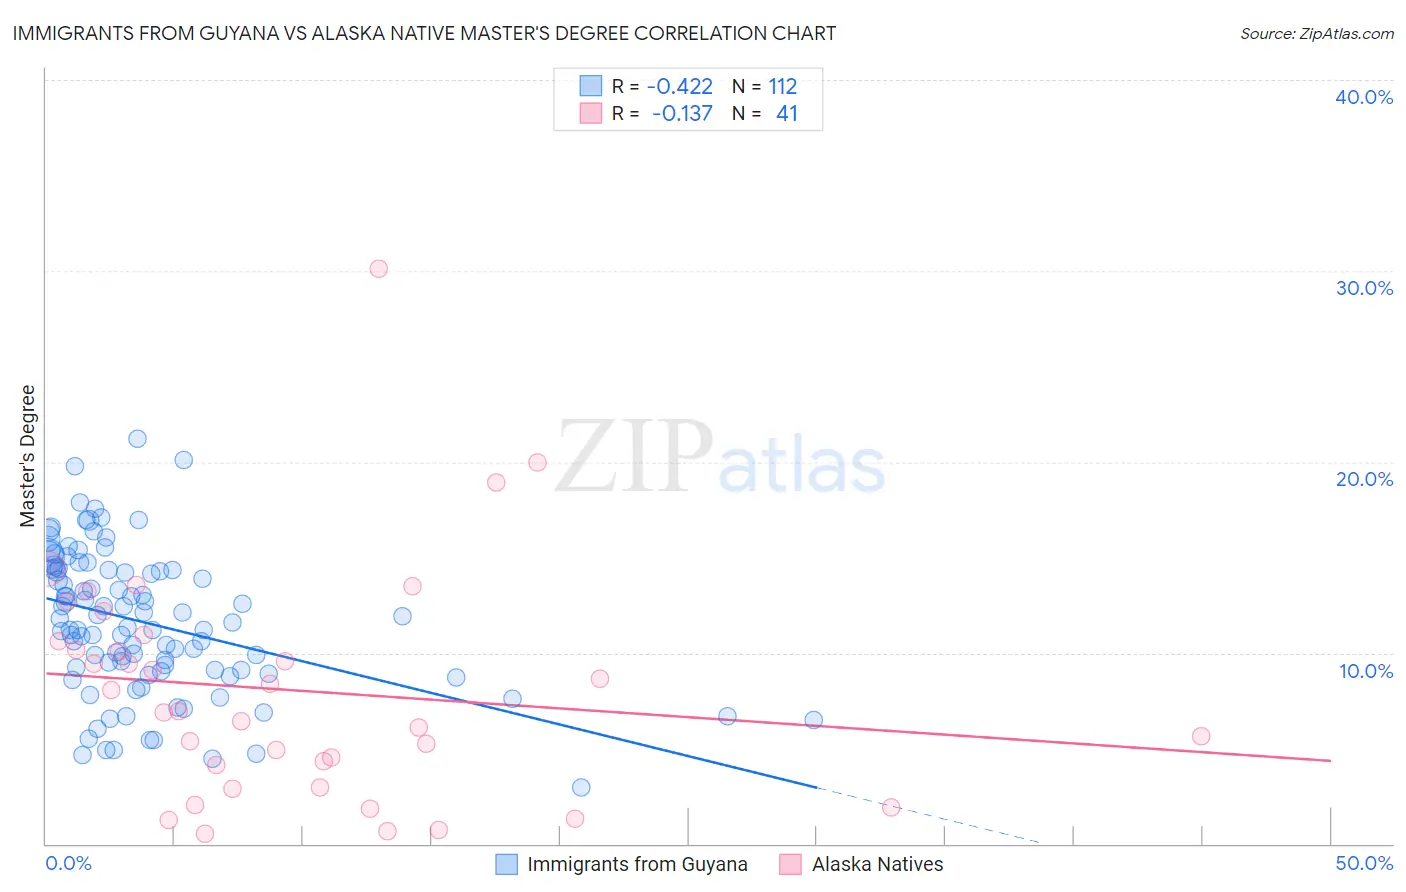
Immigrants from Guyana vs Alaska Native Master's Degree Correlation Chart
The statistical analysis conducted on geographies consisting of 183,731,921 people shows a moderate negative correlation between the proportion of Immigrants from Guyana and percentage of population with at least master's degree education in the United States with a correlation coefficient (R) of -0.422 and weighted average of 13.4%. Similarly, the statistical analysis conducted on geographies consisting of 76,746,522 people shows a poor negative correlation between the proportion of Alaska Natives and percentage of population with at least master's degree education in the United States with a correlation coefficient (R) of -0.137 and weighted average of 11.6%, a difference of 15.9%.
Master's Degree Correlation Summary
| Measurement | Immigrants from Guyana | Alaska Native |
| Minimum | 3.0% | 0.50% |
| Maximum | 21.2% | 30.1% |
| Range | 18.3% | 29.6% |
| Mean | 11.6% | 8.0% |
| Median | 11.5% | 7.0% |
| Interquartile 25% (IQ1) | 9.1% | 3.5% |
| Interquartile 75% (IQ3) | 14.3% | 10.8% |
| Interquartile Range (IQR) | 5.3% | 7.2% |
| Standard Deviation (Sample) | 3.7% | 6.0% |
| Standard Deviation (Population) | 3.7% | 5.9% |
Similar Demographics by Master's Degree
Demographics Similar to Immigrants from Guyana by Master's Degree
In terms of master's degree, the demographic groups most similar to Immigrants from Guyana are German Russian (13.5%, a difference of 0.11%), Jamaican (13.4%, a difference of 0.22%), Hmong (13.4%, a difference of 0.36%), Immigrants from Burma/Myanmar (13.5%, a difference of 0.52%), and Nonimmigrants (13.3%, a difference of 0.89%).
| Demographics | Rating | Rank | Master's Degree |
| British West Indians | 8.8 /100 | #229 | Tragic 13.8% |
| Dutch | 8.7 /100 | #230 | Tragic 13.8% |
| Guyanese | 7.6 /100 | #231 | Tragic 13.7% |
| Immigrants | Philippines | 6.0 /100 | #232 | Tragic 13.6% |
| Immigrants | Ecuador | 5.7 /100 | #233 | Tragic 13.6% |
| Immigrants | Burma/Myanmar | 5.0 /100 | #234 | Tragic 13.5% |
| German Russians | 4.5 /100 | #235 | Tragic 13.5% |
| Immigrants | Guyana | 4.4 /100 | #236 | Tragic 13.4% |
| Jamaicans | 4.1 /100 | #237 | Tragic 13.4% |
| Hmong | 4.0 /100 | #238 | Tragic 13.4% |
| Immigrants | Nonimmigrants | 3.4 /100 | #239 | Tragic 13.3% |
| Guamanians/Chamorros | 2.2 /100 | #240 | Tragic 13.1% |
| U.S. Virgin Islanders | 2.1 /100 | #241 | Tragic 13.1% |
| Spanish Americans | 1.9 /100 | #242 | Tragic 13.0% |
| Immigrants | Jamaica | 1.9 /100 | #243 | Tragic 13.0% |
Demographics Similar to Alaska Natives by Master's Degree
In terms of master's degree, the demographic groups most similar to Alaska Natives are Hawaiian (11.6%, a difference of 0.10%), Immigrants from Guatemala (11.6%, a difference of 0.23%), Marshallese (11.6%, a difference of 0.25%), Alaskan Athabascan (11.6%, a difference of 0.26%), and Colville (11.6%, a difference of 0.35%).
| Demographics | Rating | Rank | Master's Degree |
| Aleuts | 0.1 /100 | #286 | Tragic 11.8% |
| Immigrants | Haiti | 0.1 /100 | #287 | Tragic 11.8% |
| Immigrants | Honduras | 0.1 /100 | #288 | Tragic 11.8% |
| Guatemalans | 0.1 /100 | #289 | Tragic 11.7% |
| Ute | 0.1 /100 | #290 | Tragic 11.7% |
| Colville | 0.1 /100 | #291 | Tragic 11.6% |
| Immigrants | Guatemala | 0.1 /100 | #292 | Tragic 11.6% |
| Alaska Natives | 0.1 /100 | #293 | Tragic 11.6% |
| Hawaiians | 0.1 /100 | #294 | Tragic 11.6% |
| Marshallese | 0.1 /100 | #295 | Tragic 11.6% |
| Alaskan Athabascans | 0.1 /100 | #296 | Tragic 11.6% |
| Immigrants | Yemen | 0.1 /100 | #297 | Tragic 11.6% |
| Samoans | 0.1 /100 | #298 | Tragic 11.5% |
| Chickasaw | 0.1 /100 | #299 | Tragic 11.4% |
| Chippewa | 0.1 /100 | #300 | Tragic 11.4% |