Italian vs Alaska Native Female Poverty
COMPARE
Italian
Alaska Native
Female Poverty
Female Poverty Comparison
Italians
Alaska Natives
11.6%
FEMALE POVERTY
99.7/ 100
METRIC RATING
21st/ 347
METRIC RANK
14.7%
FEMALE POVERTY
1.8/ 100
METRIC RATING
230th/ 347
METRIC RANK
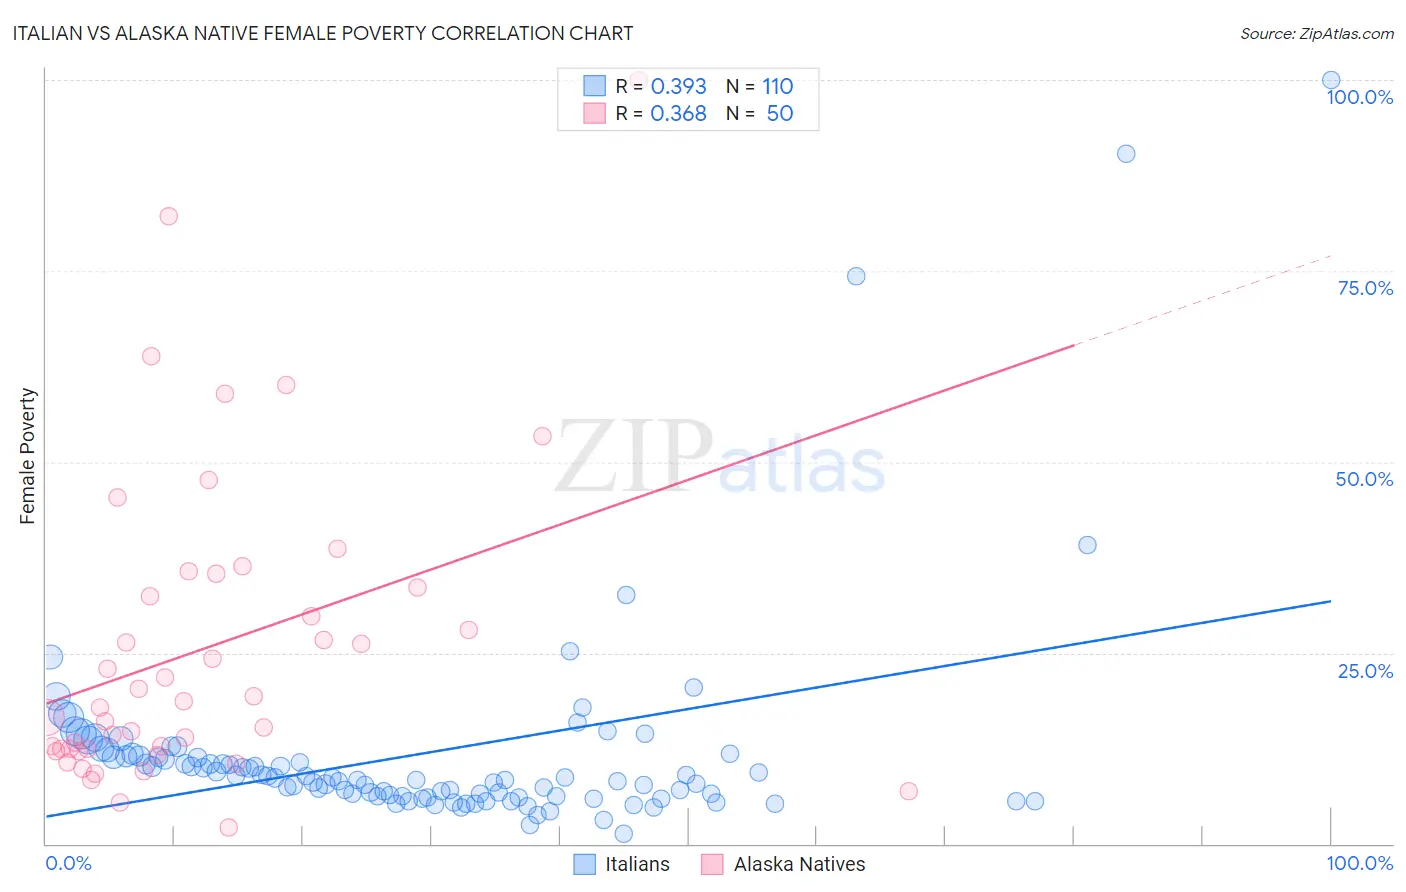
Italian vs Alaska Native Female Poverty Correlation Chart
The statistical analysis conducted on geographies consisting of 573,632,055 people shows a mild positive correlation between the proportion of Italians and poverty level among females in the United States with a correlation coefficient (R) of 0.393 and weighted average of 11.6%. Similarly, the statistical analysis conducted on geographies consisting of 76,751,650 people shows a mild positive correlation between the proportion of Alaska Natives and poverty level among females in the United States with a correlation coefficient (R) of 0.368 and weighted average of 14.7%, a difference of 27.2%.
Female Poverty Correlation Summary
| Measurement | Italian | Alaska Native |
| Minimum | 1.3% | 2.1% |
| Maximum | 100.0% | 100.0% |
| Range | 98.7% | 97.9% |
| Mean | 11.8% | 25.6% |
| Median | 8.5% | 18.2% |
| Interquartile 25% (IQ1) | 6.3% | 12.4% |
| Interquartile 75% (IQ3) | 11.4% | 33.6% |
| Interquartile Range (IQR) | 5.1% | 21.2% |
| Standard Deviation (Sample) | 14.1% | 20.2% |
| Standard Deviation (Population) | 14.0% | 20.0% |
Similar Demographics by Female Poverty
Demographics Similar to Italians by Female Poverty
In terms of female poverty, the demographic groups most similar to Italians are Swedish (11.6%, a difference of 0.030%), Burmese (11.6%, a difference of 0.17%), Luxembourger (11.6%, a difference of 0.19%), Immigrants from Northern Europe (11.6%, a difference of 0.45%), and Croatian (11.6%, a difference of 0.46%).
| Demographics | Rating | Rank | Female Poverty |
| Lithuanians | 99.8 /100 | #14 | Exceptional 11.4% |
| Latvians | 99.8 /100 | #15 | Exceptional 11.4% |
| Immigrants | Bolivia | 99.8 /100 | #16 | Exceptional 11.5% |
| Bolivians | 99.8 /100 | #17 | Exceptional 11.5% |
| Immigrants | Scotland | 99.8 /100 | #18 | Exceptional 11.5% |
| Norwegians | 99.8 /100 | #19 | Exceptional 11.5% |
| Eastern Europeans | 99.7 /100 | #20 | Exceptional 11.5% |
| Italians | 99.7 /100 | #21 | Exceptional 11.6% |
| Swedes | 99.7 /100 | #22 | Exceptional 11.6% |
| Burmese | 99.7 /100 | #23 | Exceptional 11.6% |
| Luxembourgers | 99.7 /100 | #24 | Exceptional 11.6% |
| Immigrants | Northern Europe | 99.6 /100 | #25 | Exceptional 11.6% |
| Croatians | 99.6 /100 | #26 | Exceptional 11.6% |
| Iranians | 99.6 /100 | #27 | Exceptional 11.7% |
| Immigrants | Korea | 99.6 /100 | #28 | Exceptional 11.7% |
Demographics Similar to Alaska Natives by Female Poverty
In terms of female poverty, the demographic groups most similar to Alaska Natives are Nigerian (14.8%, a difference of 0.10%), Ghanaian (14.7%, a difference of 0.20%), German Russian (14.7%, a difference of 0.27%), Immigrants from Nigeria (14.7%, a difference of 0.41%), and Osage (14.8%, a difference of 0.41%).
| Demographics | Rating | Rank | Female Poverty |
| Immigrants | Africa | 3.3 /100 | #223 | Tragic 14.5% |
| Americans | 2.8 /100 | #224 | Tragic 14.6% |
| Immigrants | Micronesia | 2.8 /100 | #225 | Tragic 14.6% |
| Immigrants | Eritrea | 2.4 /100 | #226 | Tragic 14.6% |
| Immigrants | Nigeria | 2.1 /100 | #227 | Tragic 14.7% |
| German Russians | 2.0 /100 | #228 | Tragic 14.7% |
| Ghanaians | 1.9 /100 | #229 | Tragic 14.7% |
| Alaska Natives | 1.8 /100 | #230 | Tragic 14.7% |
| Nigerians | 1.7 /100 | #231 | Tragic 14.8% |
| Osage | 1.5 /100 | #232 | Tragic 14.8% |
| Immigrants | Saudi Arabia | 1.4 /100 | #233 | Tragic 14.8% |
| Fijians | 1.1 /100 | #234 | Tragic 14.9% |
| Immigrants | Laos | 0.9 /100 | #235 | Tragic 15.0% |
| Cree | 0.7 /100 | #236 | Tragic 15.1% |
| French American Indians | 0.6 /100 | #237 | Tragic 15.1% |