Immigrants from Guatemala vs Hmong Female Poverty
COMPARE
Immigrants from Guatemala
Hmong
Female Poverty
Female Poverty Comparison
Immigrants from Guatemala
Hmong
17.0%
FEMALE POVERTY
0.0/ 100
METRIC RATING
311th/ 347
METRIC RANK
13.9%
FEMALE POVERTY
21.1/ 100
METRIC RATING
202nd/ 347
METRIC RANK
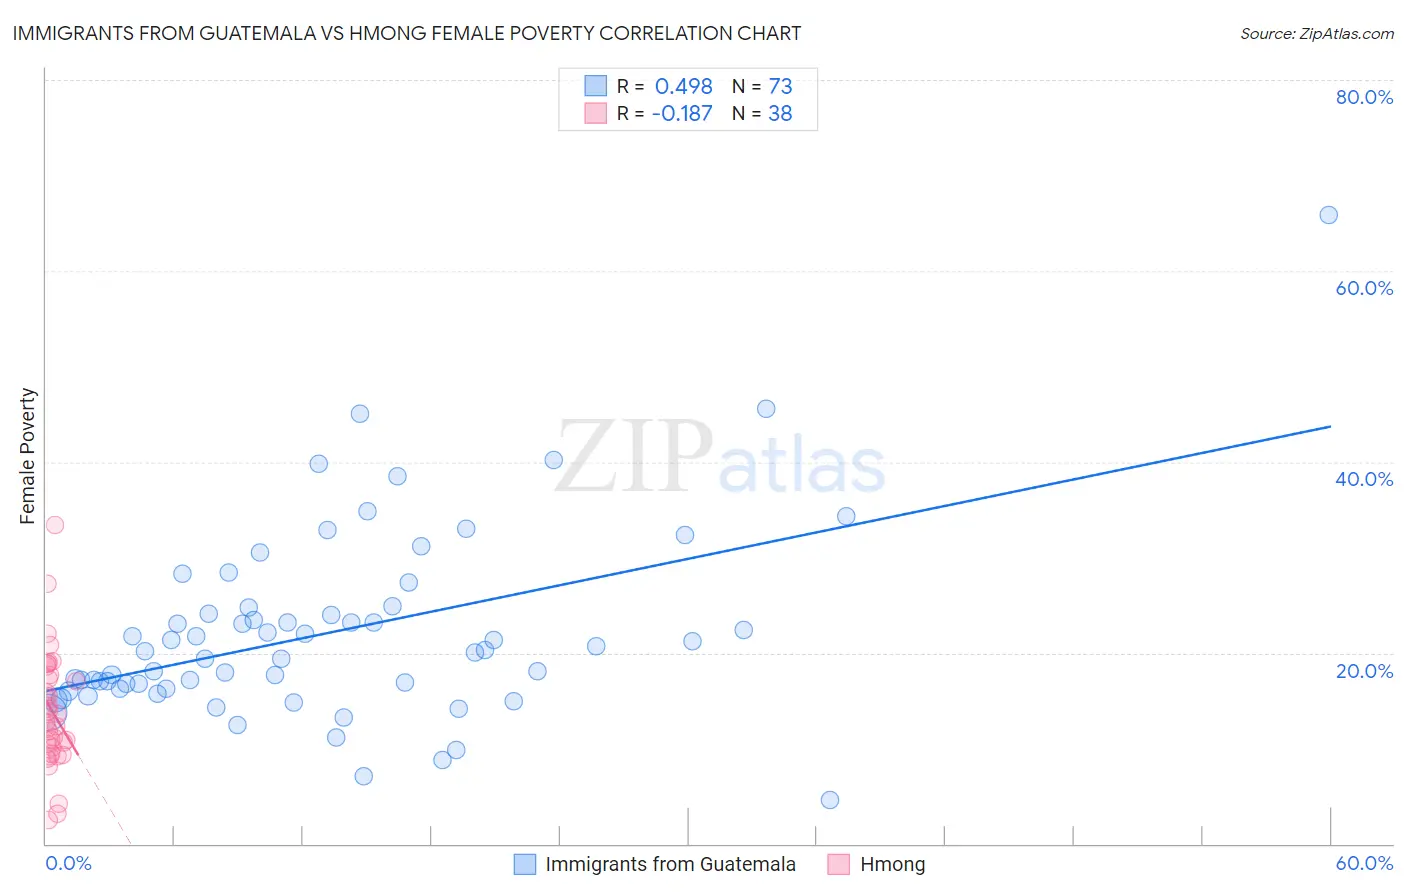
Immigrants from Guatemala vs Hmong Female Poverty Correlation Chart
The statistical analysis conducted on geographies consisting of 377,104,369 people shows a moderate positive correlation between the proportion of Immigrants from Guatemala and poverty level among females in the United States with a correlation coefficient (R) of 0.498 and weighted average of 17.0%. Similarly, the statistical analysis conducted on geographies consisting of 24,669,739 people shows a poor negative correlation between the proportion of Hmong and poverty level among females in the United States with a correlation coefficient (R) of -0.187 and weighted average of 13.9%, a difference of 22.6%.
Female Poverty Correlation Summary
| Measurement | Immigrants from Guatemala | Hmong |
| Minimum | 4.6% | 2.5% |
| Maximum | 65.8% | 33.3% |
| Range | 61.2% | 30.8% |
| Mean | 22.1% | 13.9% |
| Median | 20.2% | 13.2% |
| Interquartile 25% (IQ1) | 16.3% | 10.1% |
| Interquartile 75% (IQ3) | 24.4% | 17.7% |
| Interquartile Range (IQR) | 8.2% | 7.6% |
| Standard Deviation (Sample) | 9.8% | 6.1% |
| Standard Deviation (Population) | 9.7% | 6.1% |
Similar Demographics by Female Poverty
Demographics Similar to Immigrants from Guatemala by Female Poverty
In terms of female poverty, the demographic groups most similar to Immigrants from Guatemala are Creek (17.0%, a difference of 0.0%), Immigrants from Somalia (17.0%, a difference of 0.090%), British West Indian (17.0%, a difference of 0.17%), Immigrants from Mexico (17.0%, a difference of 0.24%), and Dutch West Indian (17.1%, a difference of 0.42%).
| Demographics | Rating | Rank | Female Poverty |
| Immigrants | Central America | 0.0 /100 | #304 | Tragic 16.8% |
| Immigrants | Grenada | 0.0 /100 | #305 | Tragic 16.8% |
| Immigrants | Caribbean | 0.0 /100 | #306 | Tragic 16.9% |
| Seminole | 0.0 /100 | #307 | Tragic 16.9% |
| Africans | 0.0 /100 | #308 | Tragic 16.9% |
| Immigrants | Mexico | 0.0 /100 | #309 | Tragic 17.0% |
| Creek | 0.0 /100 | #310 | Tragic 17.0% |
| Immigrants | Guatemala | 0.0 /100 | #311 | Tragic 17.0% |
| Immigrants | Somalia | 0.0 /100 | #312 | Tragic 17.0% |
| British West Indians | 0.0 /100 | #313 | Tragic 17.0% |
| Dutch West Indians | 0.0 /100 | #314 | Tragic 17.1% |
| U.S. Virgin Islanders | 0.0 /100 | #315 | Tragic 17.3% |
| Hondurans | 0.0 /100 | #316 | Tragic 17.4% |
| Immigrants | Congo | 0.0 /100 | #317 | Tragic 17.4% |
| Ute | 0.0 /100 | #318 | Tragic 17.5% |
Demographics Similar to Hmong by Female Poverty
In terms of female poverty, the demographic groups most similar to Hmong are Immigrants from Kenya (13.9%, a difference of 0.010%), Spanish (13.9%, a difference of 0.050%), Immigrants from Western Asia (13.9%, a difference of 0.050%), Spaniard (13.9%, a difference of 0.32%), and Immigrants from Lebanon (13.8%, a difference of 0.60%).
| Demographics | Rating | Rank | Female Poverty |
| Immigrants | South America | 30.6 /100 | #195 | Fair 13.7% |
| South American Indians | 28.9 /100 | #196 | Fair 13.7% |
| Arabs | 28.6 /100 | #197 | Fair 13.7% |
| Immigrants | Uganda | 28.5 /100 | #198 | Fair 13.7% |
| Immigrants | Lebanon | 25.6 /100 | #199 | Fair 13.8% |
| Spanish | 21.4 /100 | #200 | Fair 13.9% |
| Immigrants | Kenya | 21.1 /100 | #201 | Fair 13.9% |
| Hmong | 21.1 /100 | #202 | Fair 13.9% |
| Immigrants | Western Asia | 20.7 /100 | #203 | Fair 13.9% |
| Spaniards | 18.9 /100 | #204 | Poor 13.9% |
| Ugandans | 15.4 /100 | #205 | Poor 14.0% |
| Immigrants | Uruguay | 14.0 /100 | #206 | Poor 14.0% |
| Immigrants | Eastern Africa | 9.0 /100 | #207 | Tragic 14.2% |
| Immigrants | Azores | 7.9 /100 | #208 | Tragic 14.2% |
| Panamanians | 7.7 /100 | #209 | Tragic 14.2% |