Immigrants from Guatemala vs Mongolian Female Poverty
COMPARE
Immigrants from Guatemala
Mongolian
Female Poverty
Female Poverty Comparison
Immigrants from Guatemala
Mongolians
17.0%
FEMALE POVERTY
0.0/ 100
METRIC RATING
311th/ 347
METRIC RANK
13.4%
FEMALE POVERTY
53.6/ 100
METRIC RATING
172nd/ 347
METRIC RANK
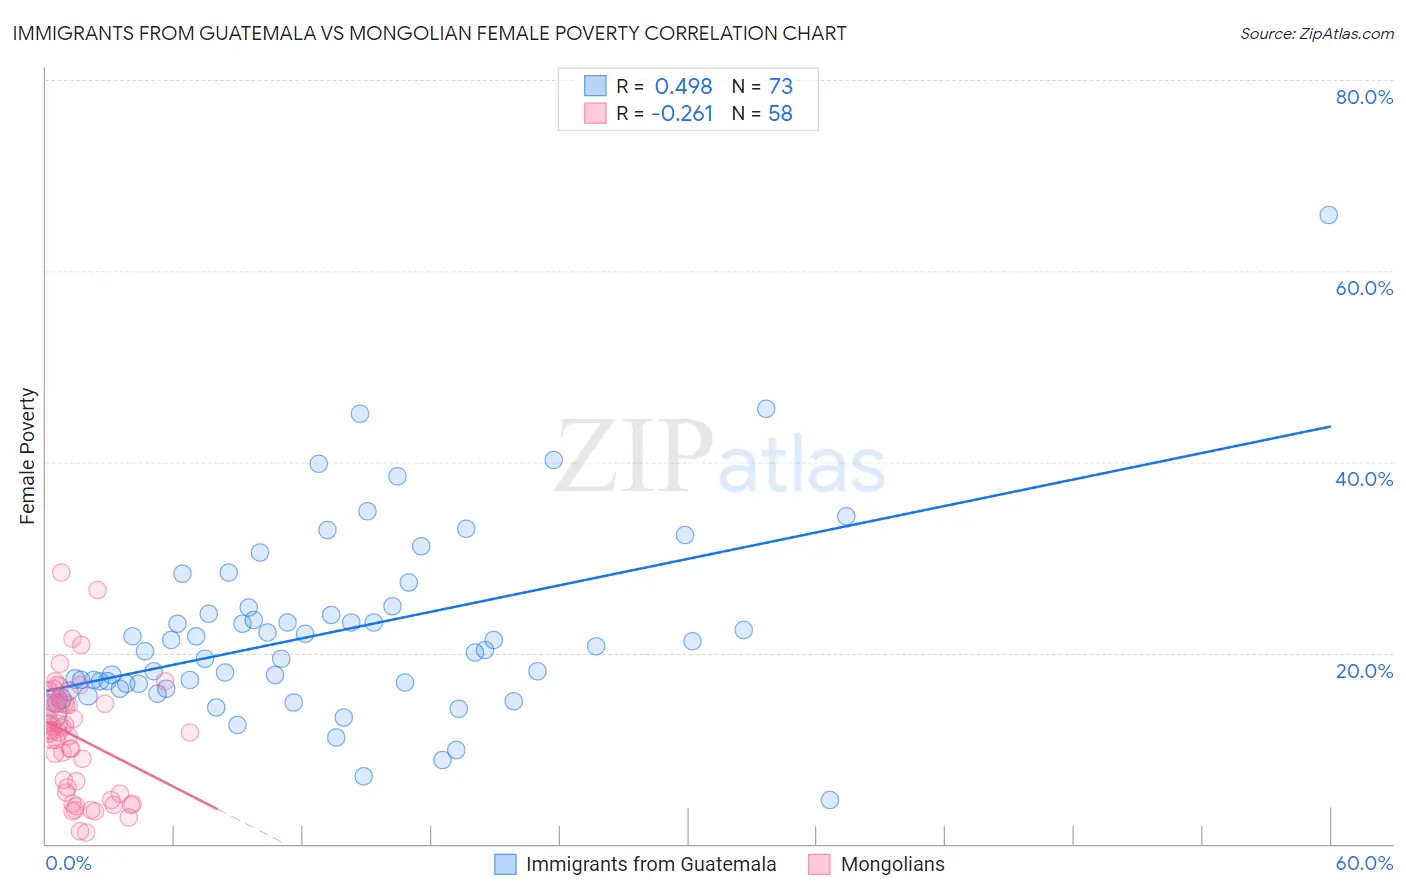
Immigrants from Guatemala vs Mongolian Female Poverty Correlation Chart
The statistical analysis conducted on geographies consisting of 377,104,369 people shows a moderate positive correlation between the proportion of Immigrants from Guatemala and poverty level among females in the United States with a correlation coefficient (R) of 0.498 and weighted average of 17.0%. Similarly, the statistical analysis conducted on geographies consisting of 140,282,925 people shows a weak negative correlation between the proportion of Mongolians and poverty level among females in the United States with a correlation coefficient (R) of -0.261 and weighted average of 13.4%, a difference of 26.9%.
Female Poverty Correlation Summary
| Measurement | Immigrants from Guatemala | Mongolian |
| Minimum | 4.6% | 1.2% |
| Maximum | 65.8% | 28.4% |
| Range | 61.2% | 27.2% |
| Mean | 22.1% | 11.2% |
| Median | 20.2% | 11.7% |
| Interquartile 25% (IQ1) | 16.3% | 5.3% |
| Interquartile 75% (IQ3) | 24.4% | 14.7% |
| Interquartile Range (IQR) | 8.2% | 9.4% |
| Standard Deviation (Sample) | 9.8% | 6.0% |
| Standard Deviation (Population) | 9.7% | 5.9% |
Similar Demographics by Female Poverty
Demographics Similar to Immigrants from Guatemala by Female Poverty
In terms of female poverty, the demographic groups most similar to Immigrants from Guatemala are Creek (17.0%, a difference of 0.0%), Immigrants from Somalia (17.0%, a difference of 0.090%), British West Indian (17.0%, a difference of 0.17%), Immigrants from Mexico (17.0%, a difference of 0.24%), and Dutch West Indian (17.1%, a difference of 0.42%).
| Demographics | Rating | Rank | Female Poverty |
| Immigrants | Central America | 0.0 /100 | #304 | Tragic 16.8% |
| Immigrants | Grenada | 0.0 /100 | #305 | Tragic 16.8% |
| Immigrants | Caribbean | 0.0 /100 | #306 | Tragic 16.9% |
| Seminole | 0.0 /100 | #307 | Tragic 16.9% |
| Africans | 0.0 /100 | #308 | Tragic 16.9% |
| Immigrants | Mexico | 0.0 /100 | #309 | Tragic 17.0% |
| Creek | 0.0 /100 | #310 | Tragic 17.0% |
| Immigrants | Guatemala | 0.0 /100 | #311 | Tragic 17.0% |
| Immigrants | Somalia | 0.0 /100 | #312 | Tragic 17.0% |
| British West Indians | 0.0 /100 | #313 | Tragic 17.0% |
| Dutch West Indians | 0.0 /100 | #314 | Tragic 17.1% |
| U.S. Virgin Islanders | 0.0 /100 | #315 | Tragic 17.3% |
| Hondurans | 0.0 /100 | #316 | Tragic 17.4% |
| Immigrants | Congo | 0.0 /100 | #317 | Tragic 17.4% |
| Ute | 0.0 /100 | #318 | Tragic 17.5% |
Demographics Similar to Mongolians by Female Poverty
In terms of female poverty, the demographic groups most similar to Mongolians are White/Caucasian (13.4%, a difference of 0.10%), Colombian (13.4%, a difference of 0.21%), Lebanese (13.4%, a difference of 0.23%), Immigrants from Afghanistan (13.4%, a difference of 0.27%), and Aleut (13.4%, a difference of 0.31%).
| Demographics | Rating | Rank | Female Poverty |
| Scotch-Irish | 62.1 /100 | #165 | Good 13.3% |
| Immigrants | Oceania | 59.7 /100 | #166 | Average 13.3% |
| Immigrants | Chile | 57.4 /100 | #167 | Average 13.3% |
| Aleuts | 56.7 /100 | #168 | Average 13.4% |
| Lebanese | 55.9 /100 | #169 | Average 13.4% |
| Colombians | 55.7 /100 | #170 | Average 13.4% |
| Whites/Caucasians | 54.6 /100 | #171 | Average 13.4% |
| Mongolians | 53.6 /100 | #172 | Average 13.4% |
| Immigrants | Afghanistan | 50.8 /100 | #173 | Average 13.4% |
| Immigrants | Iraq | 50.0 /100 | #174 | Average 13.4% |
| Celtics | 49.9 /100 | #175 | Average 13.4% |
| Immigrants | Spain | 49.9 /100 | #176 | Average 13.4% |
| Immigrants | Morocco | 49.4 /100 | #177 | Average 13.4% |
| Israelis | 49.1 /100 | #178 | Average 13.5% |
| Immigrants | Syria | 48.8 /100 | #179 | Average 13.5% |