Immigrants from Europe vs Native Hawaiian Female Poverty
COMPARE
Immigrants from Europe
Native Hawaiian
Female Poverty
Female Poverty Comparison
Immigrants from Europe
Native Hawaiians
12.1%
FEMALE POVERTY
98.2/ 100
METRIC RATING
59th/ 347
METRIC RANK
12.5%
FEMALE POVERTY
95.1/ 100
METRIC RATING
98th/ 347
METRIC RANK
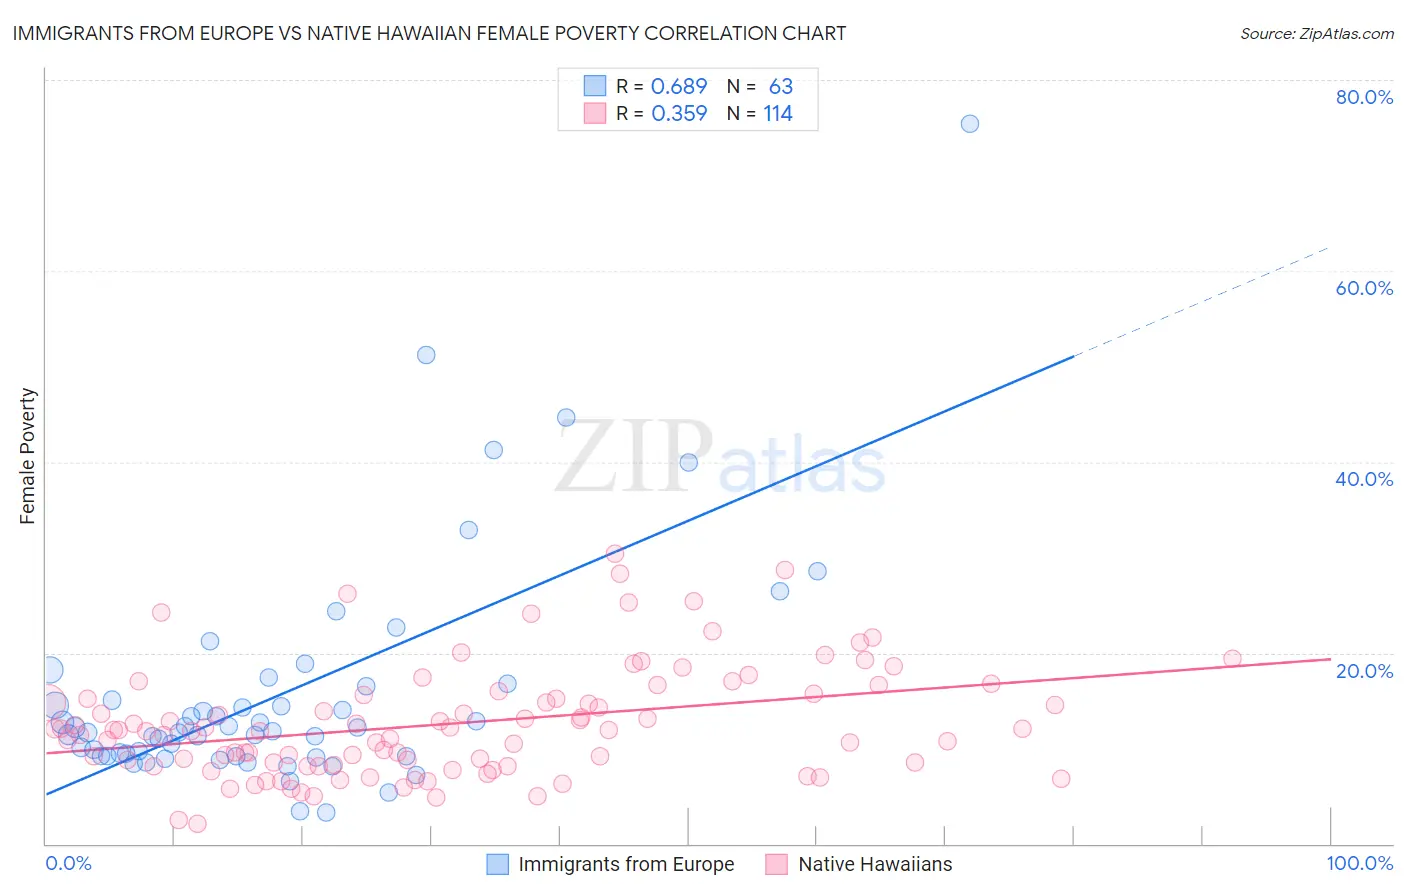
Immigrants from Europe vs Native Hawaiian Female Poverty Correlation Chart
The statistical analysis conducted on geographies consisting of 546,481,201 people shows a significant positive correlation between the proportion of Immigrants from Europe and poverty level among females in the United States with a correlation coefficient (R) of 0.689 and weighted average of 12.1%. Similarly, the statistical analysis conducted on geographies consisting of 331,828,170 people shows a mild positive correlation between the proportion of Native Hawaiians and poverty level among females in the United States with a correlation coefficient (R) of 0.359 and weighted average of 12.5%, a difference of 2.8%.
Female Poverty Correlation Summary
| Measurement | Immigrants from Europe | Native Hawaiian |
| Minimum | 3.3% | 2.1% |
| Maximum | 75.4% | 30.4% |
| Range | 72.1% | 28.2% |
| Mean | 15.7% | 12.6% |
| Median | 11.8% | 11.9% |
| Interquartile 25% (IQ1) | 9.2% | 8.2% |
| Interquartile 75% (IQ3) | 16.5% | 15.6% |
| Interquartile Range (IQR) | 7.3% | 7.3% |
| Standard Deviation (Sample) | 12.2% | 5.8% |
| Standard Deviation (Population) | 12.1% | 5.8% |
Similar Demographics by Female Poverty
Demographics Similar to Immigrants from Europe by Female Poverty
In terms of female poverty, the demographic groups most similar to Immigrants from Europe are Scandinavian (12.1%, a difference of 0.010%), Immigrants from Serbia (12.1%, a difference of 0.090%), Estonian (12.1%, a difference of 0.15%), Immigrants from Australia (12.2%, a difference of 0.24%), and Immigrants from Asia (12.2%, a difference of 0.25%).
| Demographics | Rating | Rank | Female Poverty |
| Immigrants | Croatia | 98.7 /100 | #52 | Exceptional 12.0% |
| Immigrants | Austria | 98.7 /100 | #53 | Exceptional 12.0% |
| Immigrants | Philippines | 98.7 /100 | #54 | Exceptional 12.1% |
| Immigrants | Sri Lanka | 98.5 /100 | #55 | Exceptional 12.1% |
| Estonians | 98.3 /100 | #56 | Exceptional 12.1% |
| Immigrants | Serbia | 98.3 /100 | #57 | Exceptional 12.1% |
| Scandinavians | 98.2 /100 | #58 | Exceptional 12.1% |
| Immigrants | Europe | 98.2 /100 | #59 | Exceptional 12.1% |
| Immigrants | Australia | 98.1 /100 | #60 | Exceptional 12.2% |
| Immigrants | Asia | 98.1 /100 | #61 | Exceptional 12.2% |
| Immigrants | Italy | 98.0 /100 | #62 | Exceptional 12.2% |
| Ukrainians | 98.0 /100 | #63 | Exceptional 12.2% |
| Germans | 98.0 /100 | #64 | Exceptional 12.2% |
| Indians (Asian) | 97.9 /100 | #65 | Exceptional 12.2% |
| Austrians | 97.9 /100 | #66 | Exceptional 12.2% |
Demographics Similar to Native Hawaiians by Female Poverty
In terms of female poverty, the demographic groups most similar to Native Hawaiians are Australian (12.5%, a difference of 0.020%), Romanian (12.5%, a difference of 0.020%), British (12.5%, a difference of 0.050%), Immigrants from South Africa (12.5%, a difference of 0.13%), and Immigrants from Indonesia (12.5%, a difference of 0.17%).
| Demographics | Rating | Rank | Female Poverty |
| Belgians | 95.8 /100 | #91 | Exceptional 12.4% |
| Czechoslovakians | 95.7 /100 | #92 | Exceptional 12.4% |
| Immigrants | Egypt | 95.5 /100 | #93 | Exceptional 12.5% |
| Immigrants | Indonesia | 95.4 /100 | #94 | Exceptional 12.5% |
| Immigrants | South Africa | 95.4 /100 | #95 | Exceptional 12.5% |
| British | 95.2 /100 | #96 | Exceptional 12.5% |
| Australians | 95.2 /100 | #97 | Exceptional 12.5% |
| Native Hawaiians | 95.1 /100 | #98 | Exceptional 12.5% |
| Romanians | 95.1 /100 | #99 | Exceptional 12.5% |
| Immigrants | Latvia | 94.8 /100 | #100 | Exceptional 12.5% |
| Tlingit-Haida | 94.8 /100 | #101 | Exceptional 12.5% |
| Immigrants | China | 94.5 /100 | #102 | Exceptional 12.5% |
| Slavs | 94.5 /100 | #103 | Exceptional 12.5% |
| Palestinians | 94.3 /100 | #104 | Exceptional 12.5% |
| Scottish | 94.1 /100 | #105 | Exceptional 12.5% |