Immigrants from Europe vs Guamanian/Chamorro Female Poverty
COMPARE
Immigrants from Europe
Guamanian/Chamorro
Female Poverty
Female Poverty Comparison
Immigrants from Europe
Guamanians/Chamorros
12.1%
FEMALE POVERTY
98.2/ 100
METRIC RATING
59th/ 347
METRIC RANK
13.3%
FEMALE POVERTY
62.4/ 100
METRIC RATING
162nd/ 347
METRIC RANK
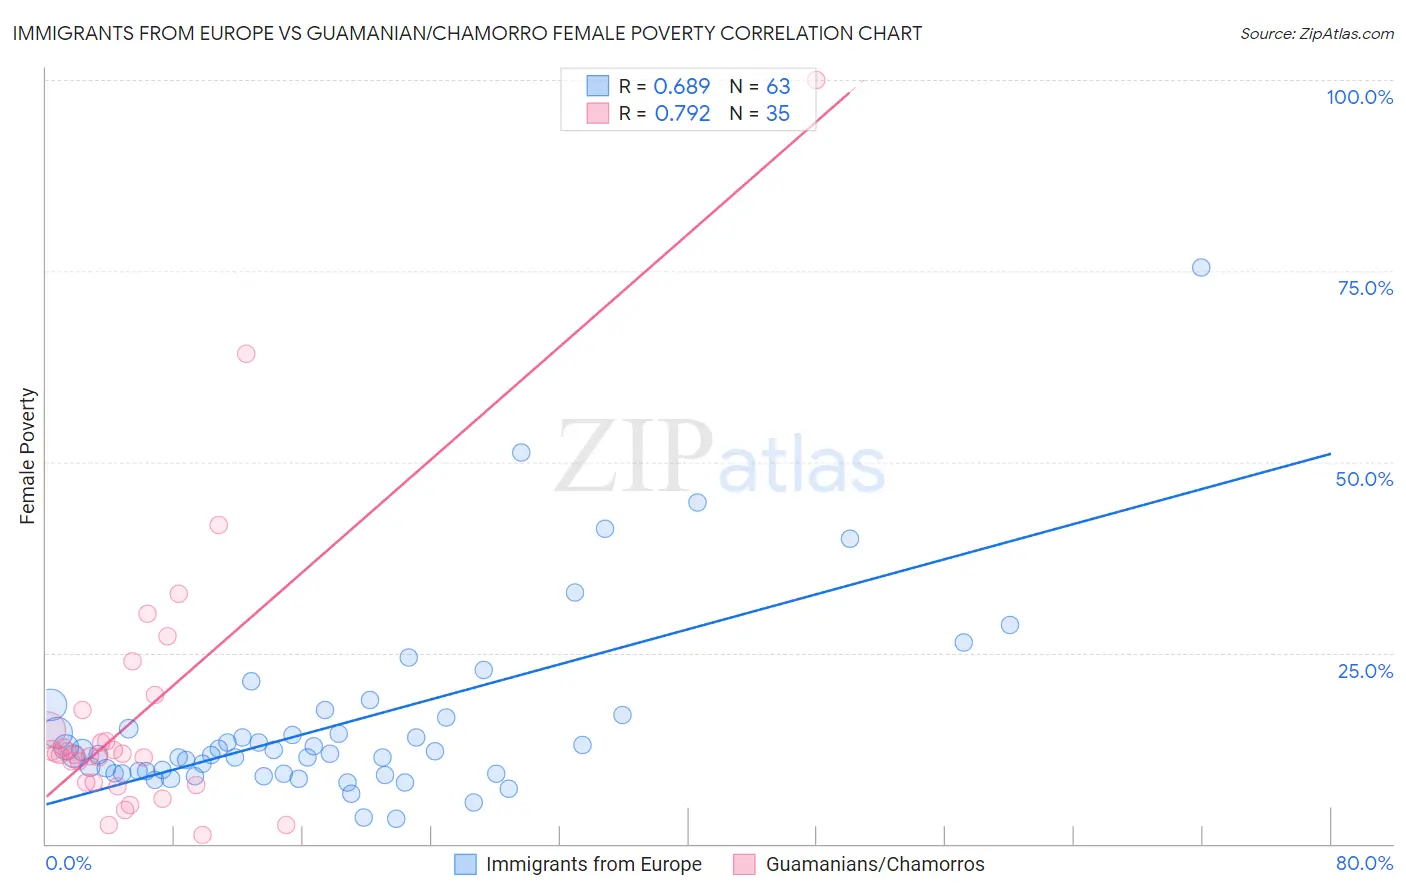
Immigrants from Europe vs Guamanian/Chamorro Female Poverty Correlation Chart
The statistical analysis conducted on geographies consisting of 546,481,201 people shows a significant positive correlation between the proportion of Immigrants from Europe and poverty level among females in the United States with a correlation coefficient (R) of 0.689 and weighted average of 12.1%. Similarly, the statistical analysis conducted on geographies consisting of 221,860,928 people shows a strong positive correlation between the proportion of Guamanians/Chamorros and poverty level among females in the United States with a correlation coefficient (R) of 0.792 and weighted average of 13.3%, a difference of 9.3%.
Female Poverty Correlation Summary
| Measurement | Immigrants from Europe | Guamanian/Chamorro |
| Minimum | 3.3% | 1.2% |
| Maximum | 75.4% | 100.0% |
| Range | 72.1% | 98.8% |
| Mean | 15.7% | 17.2% |
| Median | 11.8% | 11.7% |
| Interquartile 25% (IQ1) | 9.2% | 8.0% |
| Interquartile 75% (IQ3) | 16.5% | 17.6% |
| Interquartile Range (IQR) | 7.3% | 9.6% |
| Standard Deviation (Sample) | 12.2% | 18.9% |
| Standard Deviation (Population) | 12.1% | 18.6% |
Similar Demographics by Female Poverty
Demographics Similar to Immigrants from Europe by Female Poverty
In terms of female poverty, the demographic groups most similar to Immigrants from Europe are Scandinavian (12.1%, a difference of 0.010%), Immigrants from Serbia (12.1%, a difference of 0.090%), Estonian (12.1%, a difference of 0.15%), Immigrants from Australia (12.2%, a difference of 0.24%), and Immigrants from Asia (12.2%, a difference of 0.25%).
| Demographics | Rating | Rank | Female Poverty |
| Immigrants | Croatia | 98.7 /100 | #52 | Exceptional 12.0% |
| Immigrants | Austria | 98.7 /100 | #53 | Exceptional 12.0% |
| Immigrants | Philippines | 98.7 /100 | #54 | Exceptional 12.1% |
| Immigrants | Sri Lanka | 98.5 /100 | #55 | Exceptional 12.1% |
| Estonians | 98.3 /100 | #56 | Exceptional 12.1% |
| Immigrants | Serbia | 98.3 /100 | #57 | Exceptional 12.1% |
| Scandinavians | 98.2 /100 | #58 | Exceptional 12.1% |
| Immigrants | Europe | 98.2 /100 | #59 | Exceptional 12.1% |
| Immigrants | Australia | 98.1 /100 | #60 | Exceptional 12.2% |
| Immigrants | Asia | 98.1 /100 | #61 | Exceptional 12.2% |
| Immigrants | Italy | 98.0 /100 | #62 | Exceptional 12.2% |
| Ukrainians | 98.0 /100 | #63 | Exceptional 12.2% |
| Germans | 98.0 /100 | #64 | Exceptional 12.2% |
| Indians (Asian) | 97.9 /100 | #65 | Exceptional 12.2% |
| Austrians | 97.9 /100 | #66 | Exceptional 12.2% |
Demographics Similar to Guamanians/Chamorros by Female Poverty
In terms of female poverty, the demographic groups most similar to Guamanians/Chamorros are Immigrants from Albania (13.3%, a difference of 0.0%), Immigrants from Ethiopia (13.3%, a difference of 0.010%), Ethiopian (13.3%, a difference of 0.010%), Immigrants from Nepal (13.3%, a difference of 0.030%), and Scotch-Irish (13.3%, a difference of 0.030%).
| Demographics | Rating | Rank | Female Poverty |
| Hungarians | 70.1 /100 | #155 | Good 13.2% |
| Immigrants | Bosnia and Herzegovina | 69.7 /100 | #156 | Good 13.2% |
| Immigrants | Northern Africa | 68.8 /100 | #157 | Good 13.2% |
| Pennsylvania Germans | 67.3 /100 | #158 | Good 13.2% |
| Costa Ricans | 63.6 /100 | #159 | Good 13.3% |
| Immigrants | Nepal | 62.7 /100 | #160 | Good 13.3% |
| Immigrants | Ethiopia | 62.5 /100 | #161 | Good 13.3% |
| Guamanians/Chamorros | 62.4 /100 | #162 | Good 13.3% |
| Immigrants | Albania | 62.4 /100 | #163 | Good 13.3% |
| Ethiopians | 62.3 /100 | #164 | Good 13.3% |
| Scotch-Irish | 62.1 /100 | #165 | Good 13.3% |
| Immigrants | Oceania | 59.7 /100 | #166 | Average 13.3% |
| Immigrants | Chile | 57.4 /100 | #167 | Average 13.3% |
| Aleuts | 56.7 /100 | #168 | Average 13.4% |
| Lebanese | 55.9 /100 | #169 | Average 13.4% |