Immigrants from Europe vs Norwegian Female Poverty
COMPARE
Immigrants from Europe
Norwegian
Female Poverty
Female Poverty Comparison
Immigrants from Europe
Norwegians
12.1%
FEMALE POVERTY
98.2/ 100
METRIC RATING
59th/ 347
METRIC RANK
11.5%
FEMALE POVERTY
99.8/ 100
METRIC RATING
19th/ 347
METRIC RANK
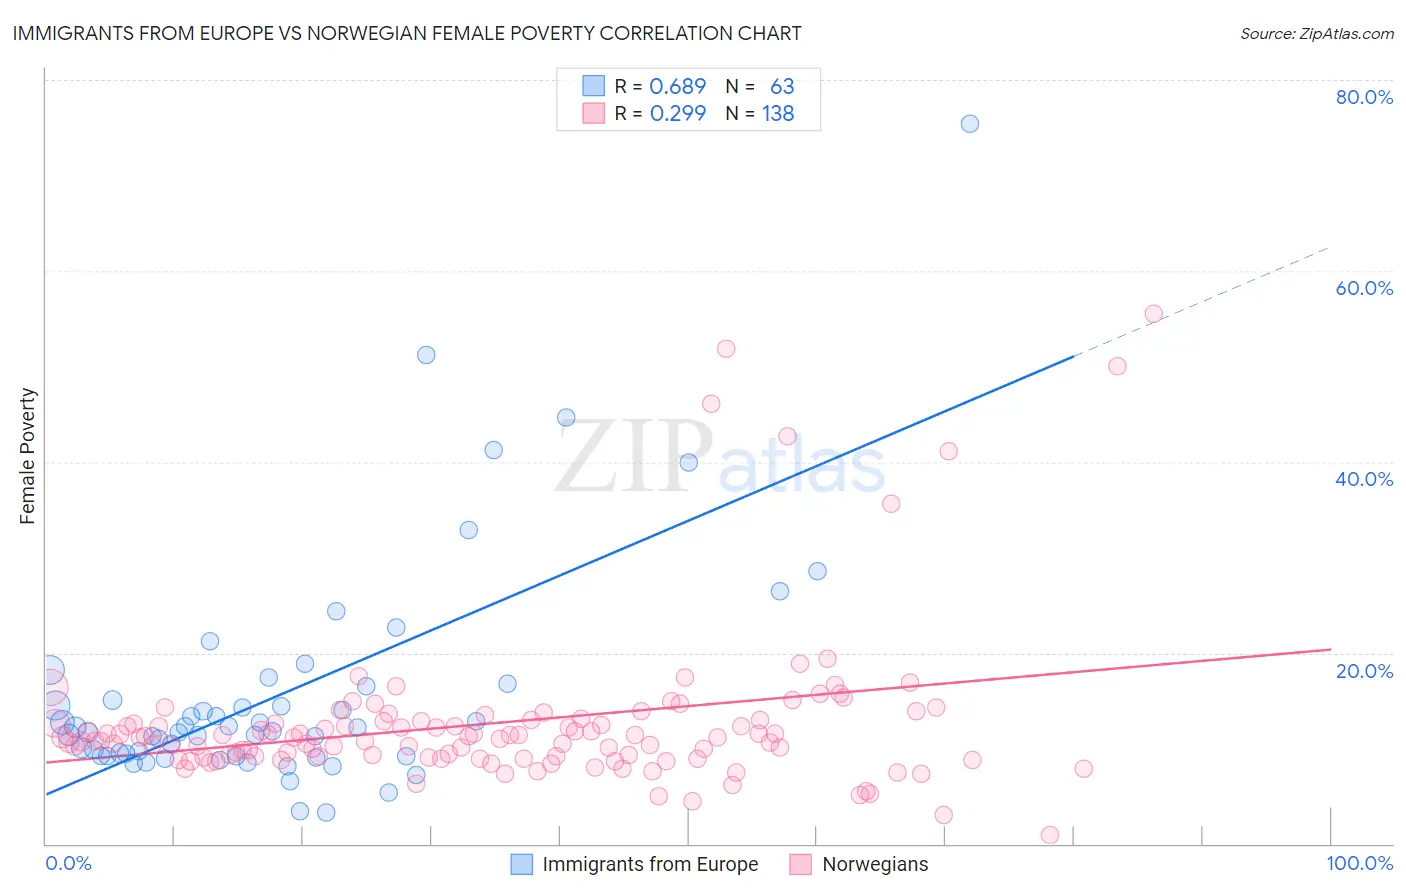
Immigrants from Europe vs Norwegian Female Poverty Correlation Chart
The statistical analysis conducted on geographies consisting of 546,481,201 people shows a significant positive correlation between the proportion of Immigrants from Europe and poverty level among females in the United States with a correlation coefficient (R) of 0.689 and weighted average of 12.1%. Similarly, the statistical analysis conducted on geographies consisting of 532,481,223 people shows a weak positive correlation between the proportion of Norwegians and poverty level among females in the United States with a correlation coefficient (R) of 0.299 and weighted average of 11.5%, a difference of 5.6%.
Female Poverty Correlation Summary
| Measurement | Immigrants from Europe | Norwegian |
| Minimum | 3.3% | 0.92% |
| Maximum | 75.4% | 55.6% |
| Range | 72.1% | 54.6% |
| Mean | 15.7% | 12.7% |
| Median | 11.8% | 11.1% |
| Interquartile 25% (IQ1) | 9.2% | 9.0% |
| Interquartile 75% (IQ3) | 16.5% | 12.9% |
| Interquartile Range (IQR) | 7.3% | 3.8% |
| Standard Deviation (Sample) | 12.2% | 8.4% |
| Standard Deviation (Population) | 12.1% | 8.4% |
Similar Demographics by Female Poverty
Demographics Similar to Immigrants from Europe by Female Poverty
In terms of female poverty, the demographic groups most similar to Immigrants from Europe are Scandinavian (12.1%, a difference of 0.010%), Immigrants from Serbia (12.1%, a difference of 0.090%), Estonian (12.1%, a difference of 0.15%), Immigrants from Australia (12.2%, a difference of 0.24%), and Immigrants from Asia (12.2%, a difference of 0.25%).
| Demographics | Rating | Rank | Female Poverty |
| Immigrants | Croatia | 98.7 /100 | #52 | Exceptional 12.0% |
| Immigrants | Austria | 98.7 /100 | #53 | Exceptional 12.0% |
| Immigrants | Philippines | 98.7 /100 | #54 | Exceptional 12.1% |
| Immigrants | Sri Lanka | 98.5 /100 | #55 | Exceptional 12.1% |
| Estonians | 98.3 /100 | #56 | Exceptional 12.1% |
| Immigrants | Serbia | 98.3 /100 | #57 | Exceptional 12.1% |
| Scandinavians | 98.2 /100 | #58 | Exceptional 12.1% |
| Immigrants | Europe | 98.2 /100 | #59 | Exceptional 12.1% |
| Immigrants | Australia | 98.1 /100 | #60 | Exceptional 12.2% |
| Immigrants | Asia | 98.1 /100 | #61 | Exceptional 12.2% |
| Immigrants | Italy | 98.0 /100 | #62 | Exceptional 12.2% |
| Ukrainians | 98.0 /100 | #63 | Exceptional 12.2% |
| Germans | 98.0 /100 | #64 | Exceptional 12.2% |
| Indians (Asian) | 97.9 /100 | #65 | Exceptional 12.2% |
| Austrians | 97.9 /100 | #66 | Exceptional 12.2% |
Demographics Similar to Norwegians by Female Poverty
In terms of female poverty, the demographic groups most similar to Norwegians are Immigrants from Scotland (11.5%, a difference of 0.040%), Bolivian (11.5%, a difference of 0.090%), Immigrants from Bolivia (11.5%, a difference of 0.16%), Eastern European (11.5%, a difference of 0.23%), and Latvian (11.4%, a difference of 0.64%).
| Demographics | Rating | Rank | Female Poverty |
| Bhutanese | 99.9 /100 | #12 | Exceptional 11.3% |
| Immigrants | Lithuania | 99.9 /100 | #13 | Exceptional 11.3% |
| Lithuanians | 99.8 /100 | #14 | Exceptional 11.4% |
| Latvians | 99.8 /100 | #15 | Exceptional 11.4% |
| Immigrants | Bolivia | 99.8 /100 | #16 | Exceptional 11.5% |
| Bolivians | 99.8 /100 | #17 | Exceptional 11.5% |
| Immigrants | Scotland | 99.8 /100 | #18 | Exceptional 11.5% |
| Norwegians | 99.8 /100 | #19 | Exceptional 11.5% |
| Eastern Europeans | 99.7 /100 | #20 | Exceptional 11.5% |
| Italians | 99.7 /100 | #21 | Exceptional 11.6% |
| Swedes | 99.7 /100 | #22 | Exceptional 11.6% |
| Burmese | 99.7 /100 | #23 | Exceptional 11.6% |
| Luxembourgers | 99.7 /100 | #24 | Exceptional 11.6% |
| Immigrants | Northern Europe | 99.6 /100 | #25 | Exceptional 11.6% |
| Croatians | 99.6 /100 | #26 | Exceptional 11.6% |