Immigrants from Europe vs Nonimmigrants Female Poverty
COMPARE
Immigrants from Europe
Nonimmigrants
Female Poverty
Female Poverty Comparison
Immigrants from Europe
Nonimmigrants
12.1%
FEMALE POVERTY
98.2/ 100
METRIC RATING
59th/ 347
METRIC RANK
14.5%
FEMALE POVERTY
3.7/ 100
METRIC RATING
222nd/ 347
METRIC RANK
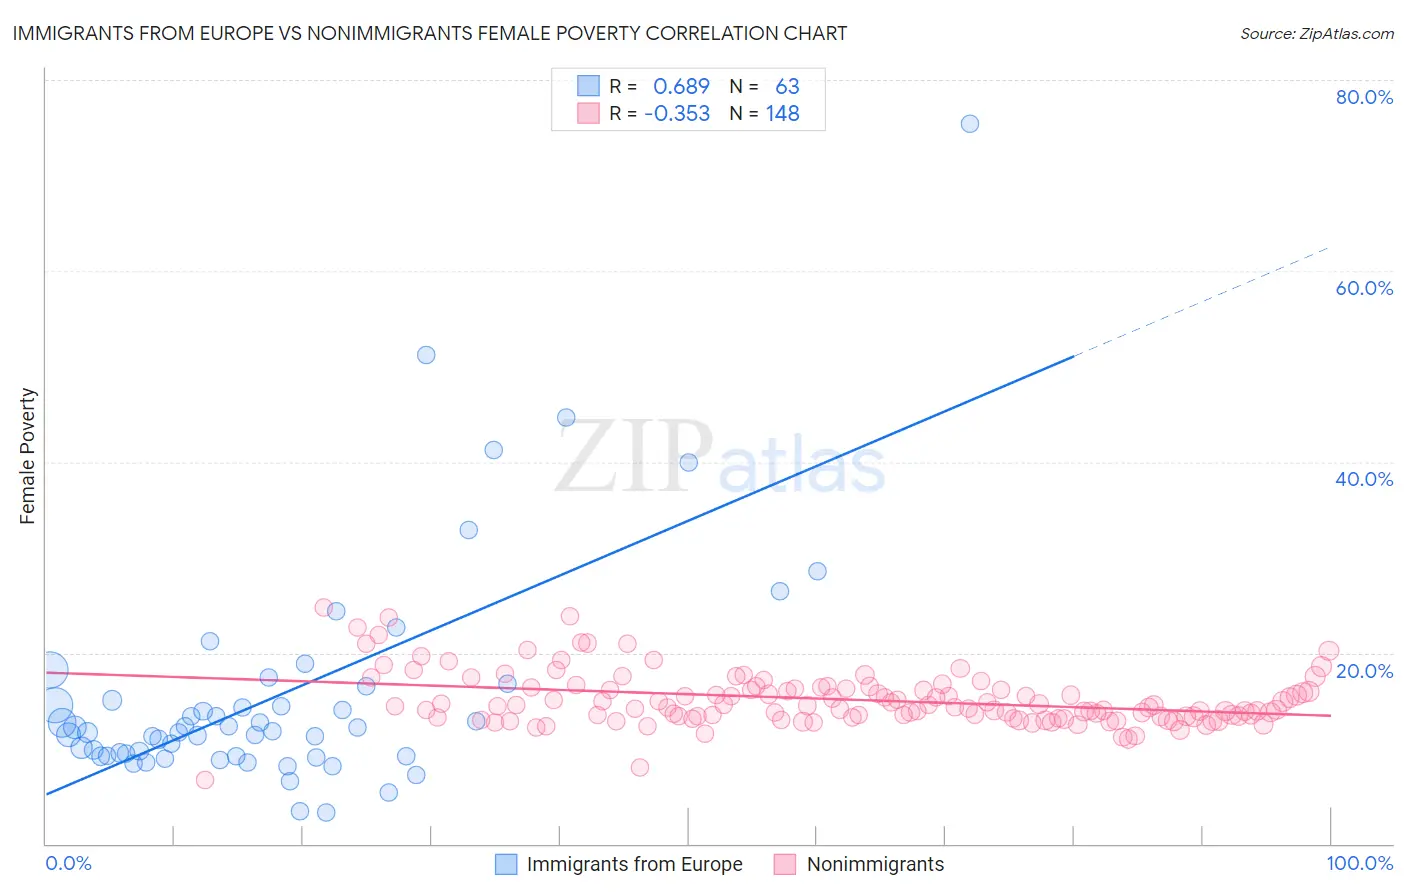
Immigrants from Europe vs Nonimmigrants Female Poverty Correlation Chart
The statistical analysis conducted on geographies consisting of 546,481,201 people shows a significant positive correlation between the proportion of Immigrants from Europe and poverty level among females in the United States with a correlation coefficient (R) of 0.689 and weighted average of 12.1%. Similarly, the statistical analysis conducted on geographies consisting of 583,225,965 people shows a mild negative correlation between the proportion of Nonimmigrants and poverty level among females in the United States with a correlation coefficient (R) of -0.353 and weighted average of 14.5%, a difference of 19.4%.
Female Poverty Correlation Summary
| Measurement | Immigrants from Europe | Nonimmigrants |
| Minimum | 3.3% | 6.7% |
| Maximum | 75.4% | 24.7% |
| Range | 72.1% | 18.0% |
| Mean | 15.7% | 15.1% |
| Median | 11.8% | 14.4% |
| Interquartile 25% (IQ1) | 9.2% | 13.3% |
| Interquartile 75% (IQ3) | 16.5% | 16.3% |
| Interquartile Range (IQR) | 7.3% | 3.0% |
| Standard Deviation (Sample) | 12.2% | 2.8% |
| Standard Deviation (Population) | 12.1% | 2.8% |
Similar Demographics by Female Poverty
Demographics Similar to Immigrants from Europe by Female Poverty
In terms of female poverty, the demographic groups most similar to Immigrants from Europe are Scandinavian (12.1%, a difference of 0.010%), Immigrants from Serbia (12.1%, a difference of 0.090%), Estonian (12.1%, a difference of 0.15%), Immigrants from Australia (12.2%, a difference of 0.24%), and Immigrants from Asia (12.2%, a difference of 0.25%).
| Demographics | Rating | Rank | Female Poverty |
| Immigrants | Croatia | 98.7 /100 | #52 | Exceptional 12.0% |
| Immigrants | Austria | 98.7 /100 | #53 | Exceptional 12.0% |
| Immigrants | Philippines | 98.7 /100 | #54 | Exceptional 12.1% |
| Immigrants | Sri Lanka | 98.5 /100 | #55 | Exceptional 12.1% |
| Estonians | 98.3 /100 | #56 | Exceptional 12.1% |
| Immigrants | Serbia | 98.3 /100 | #57 | Exceptional 12.1% |
| Scandinavians | 98.2 /100 | #58 | Exceptional 12.1% |
| Immigrants | Europe | 98.2 /100 | #59 | Exceptional 12.1% |
| Immigrants | Australia | 98.1 /100 | #60 | Exceptional 12.2% |
| Immigrants | Asia | 98.1 /100 | #61 | Exceptional 12.2% |
| Immigrants | Italy | 98.0 /100 | #62 | Exceptional 12.2% |
| Ukrainians | 98.0 /100 | #63 | Exceptional 12.2% |
| Germans | 98.0 /100 | #64 | Exceptional 12.2% |
| Indians (Asian) | 97.9 /100 | #65 | Exceptional 12.2% |
| Austrians | 97.9 /100 | #66 | Exceptional 12.2% |
Demographics Similar to Nonimmigrants by Female Poverty
In terms of female poverty, the demographic groups most similar to Nonimmigrants are Immigrants from Cambodia (14.5%, a difference of 0.020%), Alsatian (14.5%, a difference of 0.22%), Immigrants from Africa (14.5%, a difference of 0.23%), Japanese (14.5%, a difference of 0.26%), and Immigrants from Uzbekistan (14.4%, a difference of 0.40%).
| Demographics | Rating | Rank | Female Poverty |
| Immigrants | Panama | 4.7 /100 | #215 | Tragic 14.4% |
| Immigrants | Thailand | 4.5 /100 | #216 | Tragic 14.4% |
| Immigrants | Immigrants | 4.5 /100 | #217 | Tragic 14.4% |
| Immigrants | Uzbekistan | 4.4 /100 | #218 | Tragic 14.4% |
| Japanese | 4.1 /100 | #219 | Tragic 14.5% |
| Alsatians | 4.0 /100 | #220 | Tragic 14.5% |
| Immigrants | Cambodia | 3.7 /100 | #221 | Tragic 14.5% |
| Immigrants | Nonimmigrants | 3.7 /100 | #222 | Tragic 14.5% |
| Immigrants | Africa | 3.3 /100 | #223 | Tragic 14.5% |
| Americans | 2.8 /100 | #224 | Tragic 14.6% |
| Immigrants | Micronesia | 2.8 /100 | #225 | Tragic 14.6% |
| Immigrants | Eritrea | 2.4 /100 | #226 | Tragic 14.6% |
| Immigrants | Nigeria | 2.1 /100 | #227 | Tragic 14.7% |
| German Russians | 2.0 /100 | #228 | Tragic 14.7% |
| Ghanaians | 1.9 /100 | #229 | Tragic 14.7% |