Immigrants from Ethiopia vs Lumbee Child Poverty Among Girls Under 16
COMPARE
Immigrants from Ethiopia
Lumbee
Child Poverty Among Girls Under 16
Child Poverty Among Girls Under 16 Comparison
Immigrants from Ethiopia
Lumbee
16.6%
CHILD POVERTY AMONG GIRLS UNDER 16
43.1/ 100
METRIC RATING
182nd/ 347
METRIC RANK
30.7%
CHILD POVERTY AMONG GIRLS UNDER 16
0.0/ 100
METRIC RATING
345th/ 347
METRIC RANK
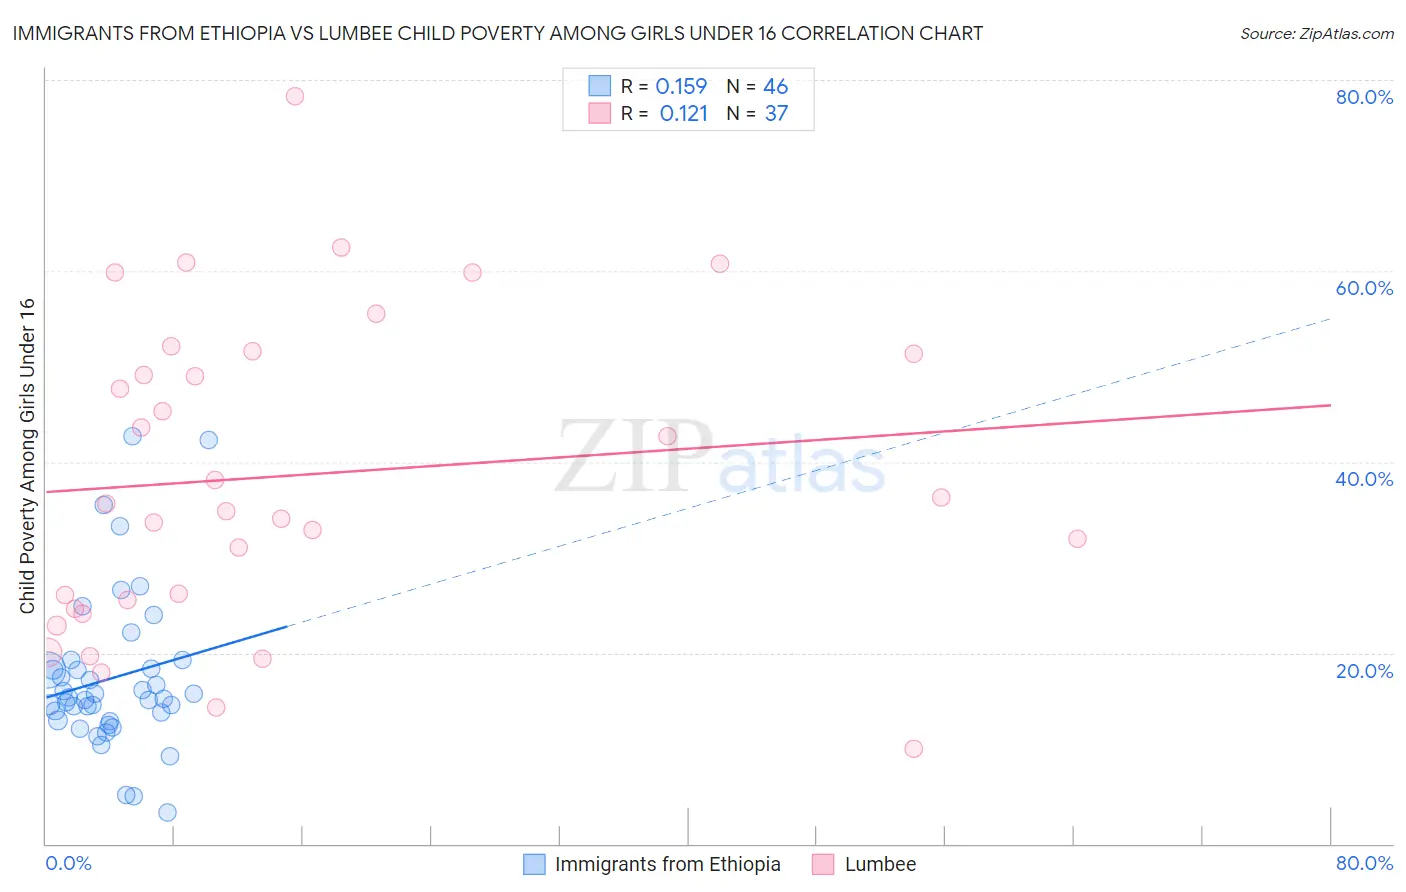
Immigrants from Ethiopia vs Lumbee Child Poverty Among Girls Under 16 Correlation Chart
The statistical analysis conducted on geographies consisting of 209,782,942 people shows a poor positive correlation between the proportion of Immigrants from Ethiopia and poverty level among girls under the age of 16 in the United States with a correlation coefficient (R) of 0.159 and weighted average of 16.6%. Similarly, the statistical analysis conducted on geographies consisting of 91,796,627 people shows a poor positive correlation between the proportion of Lumbee and poverty level among girls under the age of 16 in the United States with a correlation coefficient (R) of 0.121 and weighted average of 30.7%, a difference of 85.0%.
Child Poverty Among Girls Under 16 Correlation Summary
| Measurement | Immigrants from Ethiopia | Lumbee |
| Minimum | 3.2% | 10.0% |
| Maximum | 42.7% | 78.3% |
| Range | 39.5% | 68.3% |
| Mean | 17.4% | 38.6% |
| Median | 15.3% | 35.6% |
| Interquartile 25% (IQ1) | 12.9% | 25.0% |
| Interquartile 75% (IQ3) | 18.4% | 51.4% |
| Interquartile Range (IQR) | 5.5% | 26.4% |
| Standard Deviation (Sample) | 8.2% | 16.2% |
| Standard Deviation (Population) | 8.2% | 16.0% |
Similar Demographics by Child Poverty Among Girls Under 16
Demographics Similar to Immigrants from Ethiopia by Child Poverty Among Girls Under 16
In terms of child poverty among girls under 16, the demographic groups most similar to Immigrants from Ethiopia are Immigrants from Iraq (16.6%, a difference of 0.010%), Immigrants from Syria (16.6%, a difference of 0.030%), Hawaiian (16.6%, a difference of 0.040%), White/Caucasian (16.6%, a difference of 0.070%), and Immigrants from Portugal (16.6%, a difference of 0.070%).
| Demographics | Rating | Rank | Child Poverty Among Girls Under 16 |
| Lebanese | 45.4 /100 | #175 | Average 16.6% |
| Hungarians | 45.1 /100 | #176 | Average 16.6% |
| Immigrants | Western Asia | 44.1 /100 | #177 | Average 16.6% |
| Whites/Caucasians | 43.6 /100 | #178 | Average 16.6% |
| Hawaiians | 43.4 /100 | #179 | Average 16.6% |
| Immigrants | Syria | 43.3 /100 | #180 | Average 16.6% |
| Immigrants | Iraq | 43.2 /100 | #181 | Average 16.6% |
| Immigrants | Ethiopia | 43.1 /100 | #182 | Average 16.6% |
| Immigrants | Portugal | 42.5 /100 | #183 | Average 16.6% |
| Scotch-Irish | 39.6 /100 | #184 | Fair 16.7% |
| Immigrants | Uruguay | 35.6 /100 | #185 | Fair 16.7% |
| South American Indians | 35.0 /100 | #186 | Fair 16.8% |
| Immigrants | Morocco | 34.6 /100 | #187 | Fair 16.8% |
| Arabs | 34.5 /100 | #188 | Fair 16.8% |
| Immigrants | Bosnia and Herzegovina | 32.5 /100 | #189 | Fair 16.8% |
Demographics Similar to Lumbee by Child Poverty Among Girls Under 16
In terms of child poverty among girls under 16, the demographic groups most similar to Lumbee are Navajo (30.5%, a difference of 0.78%), Tohono O'odham (31.6%, a difference of 2.9%), Immigrants from Yemen (29.5%, a difference of 4.1%), Puerto Rican (32.7%, a difference of 6.4%), and Pima (28.2%, a difference of 8.8%).
| Demographics | Rating | Rank | Child Poverty Among Girls Under 16 |
| Blacks/African Americans | 0.0 /100 | #333 | Tragic 24.7% |
| Menominee | 0.0 /100 | #334 | Tragic 25.0% |
| Pueblo | 0.0 /100 | #335 | Tragic 25.2% |
| Sioux | 0.0 /100 | #336 | Tragic 25.6% |
| Yup'ik | 0.0 /100 | #337 | Tragic 25.8% |
| Cheyenne | 0.0 /100 | #338 | Tragic 26.3% |
| Crow | 0.0 /100 | #339 | Tragic 26.4% |
| Yuman | 0.0 /100 | #340 | Tragic 27.1% |
| Hopi | 0.0 /100 | #341 | Tragic 27.9% |
| Pima | 0.0 /100 | #342 | Tragic 28.2% |
| Immigrants | Yemen | 0.0 /100 | #343 | Tragic 29.5% |
| Navajo | 0.0 /100 | #344 | Tragic 30.5% |
| Lumbee | 0.0 /100 | #345 | Tragic 30.7% |
| Tohono O'odham | 0.0 /100 | #346 | Tragic 31.6% |
| Puerto Ricans | 0.0 /100 | #347 | Tragic 32.7% |