Immigrants from Ethiopia vs Immigrants from Philippines Child Poverty Among Girls Under 16
COMPARE
Immigrants from Ethiopia
Immigrants from Philippines
Child Poverty Among Girls Under 16
Child Poverty Among Girls Under 16 Comparison
Immigrants from Ethiopia
Immigrants from Philippines
16.6%
CHILD POVERTY AMONG GIRLS UNDER 16
43.1/ 100
METRIC RATING
182nd/ 347
METRIC RANK
14.4%
CHILD POVERTY AMONG GIRLS UNDER 16
98.6/ 100
METRIC RATING
64th/ 347
METRIC RANK
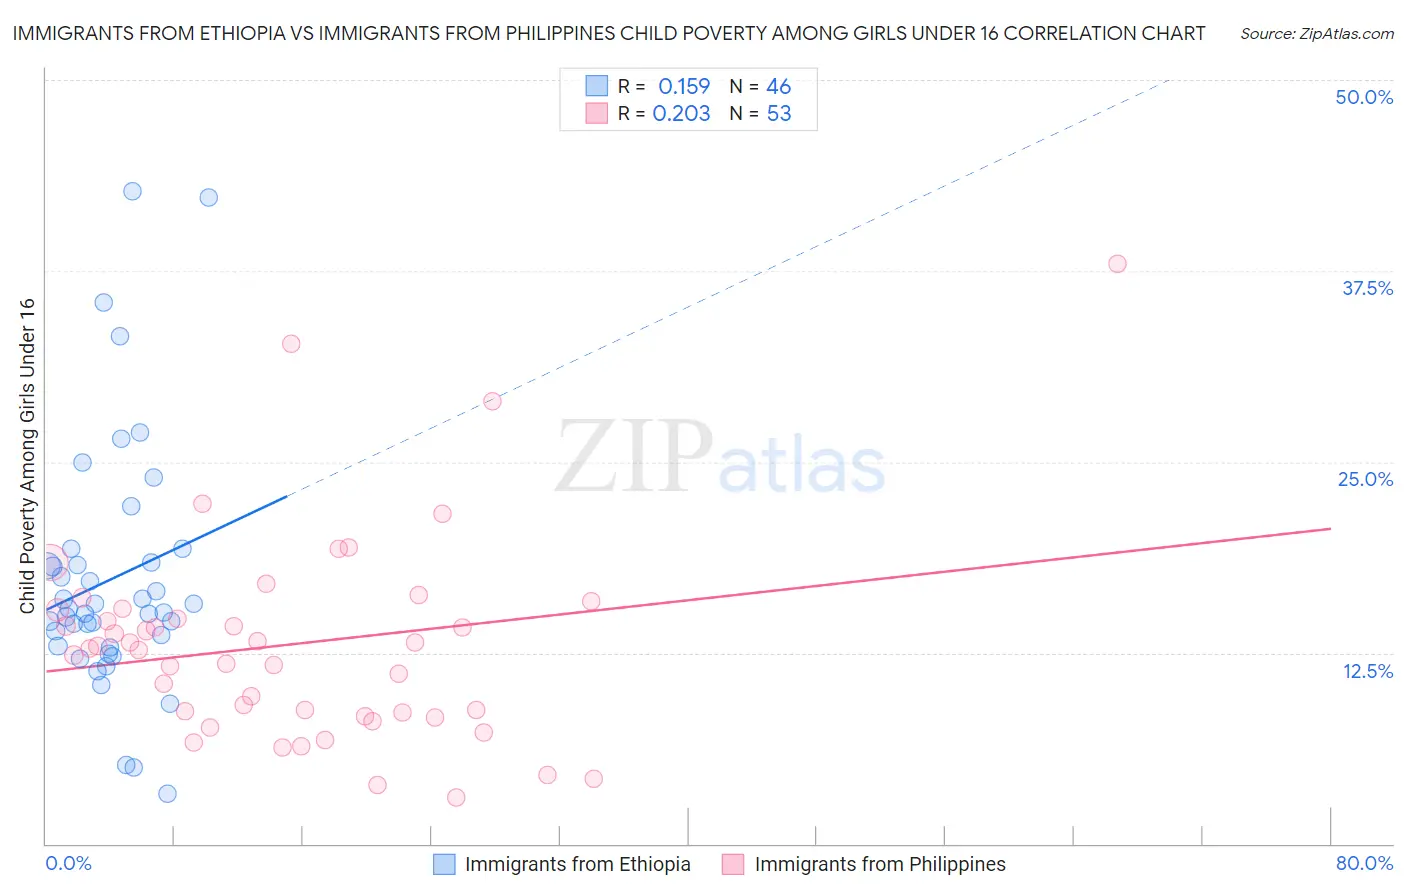
Immigrants from Ethiopia vs Immigrants from Philippines Child Poverty Among Girls Under 16 Correlation Chart
The statistical analysis conducted on geographies consisting of 209,782,942 people shows a poor positive correlation between the proportion of Immigrants from Ethiopia and poverty level among girls under the age of 16 in the United States with a correlation coefficient (R) of 0.159 and weighted average of 16.6%. Similarly, the statistical analysis conducted on geographies consisting of 461,157,064 people shows a weak positive correlation between the proportion of Immigrants from Philippines and poverty level among girls under the age of 16 in the United States with a correlation coefficient (R) of 0.203 and weighted average of 14.4%, a difference of 14.9%.
Child Poverty Among Girls Under 16 Correlation Summary
| Measurement | Immigrants from Ethiopia | Immigrants from Philippines |
| Minimum | 3.2% | 3.0% |
| Maximum | 42.7% | 38.0% |
| Range | 39.5% | 35.0% |
| Mean | 17.4% | 13.1% |
| Median | 15.3% | 12.8% |
| Interquartile 25% (IQ1) | 12.9% | 8.5% |
| Interquartile 75% (IQ3) | 18.4% | 15.3% |
| Interquartile Range (IQR) | 5.5% | 6.9% |
| Standard Deviation (Sample) | 8.2% | 6.7% |
| Standard Deviation (Population) | 8.2% | 6.7% |
Similar Demographics by Child Poverty Among Girls Under 16
Demographics Similar to Immigrants from Ethiopia by Child Poverty Among Girls Under 16
In terms of child poverty among girls under 16, the demographic groups most similar to Immigrants from Ethiopia are Immigrants from Iraq (16.6%, a difference of 0.010%), Immigrants from Syria (16.6%, a difference of 0.030%), Hawaiian (16.6%, a difference of 0.040%), White/Caucasian (16.6%, a difference of 0.070%), and Immigrants from Portugal (16.6%, a difference of 0.070%).
| Demographics | Rating | Rank | Child Poverty Among Girls Under 16 |
| Lebanese | 45.4 /100 | #175 | Average 16.6% |
| Hungarians | 45.1 /100 | #176 | Average 16.6% |
| Immigrants | Western Asia | 44.1 /100 | #177 | Average 16.6% |
| Whites/Caucasians | 43.6 /100 | #178 | Average 16.6% |
| Hawaiians | 43.4 /100 | #179 | Average 16.6% |
| Immigrants | Syria | 43.3 /100 | #180 | Average 16.6% |
| Immigrants | Iraq | 43.2 /100 | #181 | Average 16.6% |
| Immigrants | Ethiopia | 43.1 /100 | #182 | Average 16.6% |
| Immigrants | Portugal | 42.5 /100 | #183 | Average 16.6% |
| Scotch-Irish | 39.6 /100 | #184 | Fair 16.7% |
| Immigrants | Uruguay | 35.6 /100 | #185 | Fair 16.7% |
| South American Indians | 35.0 /100 | #186 | Fair 16.8% |
| Immigrants | Morocco | 34.6 /100 | #187 | Fair 16.8% |
| Arabs | 34.5 /100 | #188 | Fair 16.8% |
| Immigrants | Bosnia and Herzegovina | 32.5 /100 | #189 | Fair 16.8% |
Demographics Similar to Immigrants from Philippines by Child Poverty Among Girls Under 16
In terms of child poverty among girls under 16, the demographic groups most similar to Immigrants from Philippines are Immigrants from Sweden (14.5%, a difference of 0.030%), Immigrants from Europe (14.4%, a difference of 0.11%), Scandinavian (14.4%, a difference of 0.16%), Immigrants from Belgium (14.5%, a difference of 0.19%), and Polish (14.4%, a difference of 0.27%).
| Demographics | Rating | Rank | Child Poverty Among Girls Under 16 |
| Immigrants | Serbia | 98.9 /100 | #57 | Exceptional 14.4% |
| Immigrants | Bulgaria | 98.8 /100 | #58 | Exceptional 14.4% |
| Zimbabweans | 98.8 /100 | #59 | Exceptional 14.4% |
| Poles | 98.7 /100 | #60 | Exceptional 14.4% |
| Cambodians | 98.7 /100 | #61 | Exceptional 14.4% |
| Scandinavians | 98.7 /100 | #62 | Exceptional 14.4% |
| Immigrants | Europe | 98.7 /100 | #63 | Exceptional 14.4% |
| Immigrants | Philippines | 98.6 /100 | #64 | Exceptional 14.4% |
| Immigrants | Sweden | 98.6 /100 | #65 | Exceptional 14.5% |
| Immigrants | Belgium | 98.5 /100 | #66 | Exceptional 14.5% |
| Laotians | 98.4 /100 | #67 | Exceptional 14.5% |
| Immigrants | Argentina | 98.3 /100 | #68 | Exceptional 14.6% |
| Immigrants | Poland | 98.2 /100 | #69 | Exceptional 14.6% |
| Europeans | 98.1 /100 | #70 | Exceptional 14.6% |
| Slovenes | 98.1 /100 | #71 | Exceptional 14.6% |