Immigrants from Colombia vs Lumbee Child Poverty Among Girls Under 16
COMPARE
Immigrants from Colombia
Lumbee
Child Poverty Among Girls Under 16
Child Poverty Among Girls Under 16 Comparison
Immigrants from Colombia
Lumbee
16.1%
CHILD POVERTY AMONG GIRLS UNDER 16
67.8/ 100
METRIC RATING
164th/ 347
METRIC RANK
30.7%
CHILD POVERTY AMONG GIRLS UNDER 16
0.0/ 100
METRIC RATING
345th/ 347
METRIC RANK
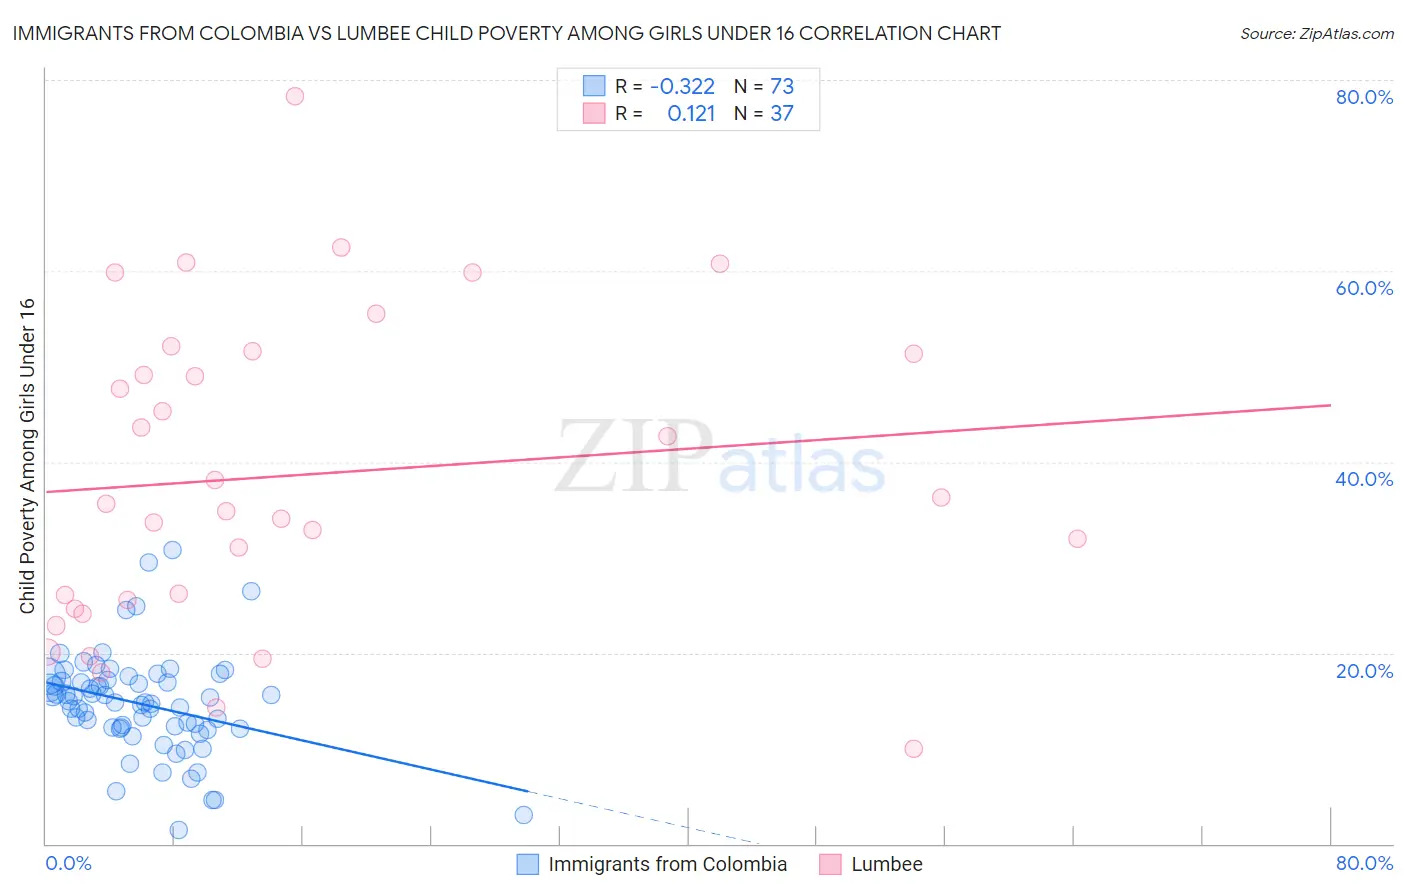
Immigrants from Colombia vs Lumbee Child Poverty Among Girls Under 16 Correlation Chart
The statistical analysis conducted on geographies consisting of 372,546,241 people shows a mild negative correlation between the proportion of Immigrants from Colombia and poverty level among girls under the age of 16 in the United States with a correlation coefficient (R) of -0.322 and weighted average of 16.1%. Similarly, the statistical analysis conducted on geographies consisting of 91,796,627 people shows a poor positive correlation between the proportion of Lumbee and poverty level among girls under the age of 16 in the United States with a correlation coefficient (R) of 0.121 and weighted average of 30.7%, a difference of 90.6%.
Child Poverty Among Girls Under 16 Correlation Summary
| Measurement | Immigrants from Colombia | Lumbee |
| Minimum | 1.5% | 10.0% |
| Maximum | 30.8% | 78.3% |
| Range | 29.3% | 68.3% |
| Mean | 14.6% | 38.6% |
| Median | 14.9% | 35.6% |
| Interquartile 25% (IQ1) | 12.2% | 25.0% |
| Interquartile 75% (IQ3) | 17.1% | 51.4% |
| Interquartile Range (IQR) | 4.9% | 26.4% |
| Standard Deviation (Sample) | 5.3% | 16.2% |
| Standard Deviation (Population) | 5.3% | 16.0% |
Similar Demographics by Child Poverty Among Girls Under 16
Demographics Similar to Immigrants from Colombia by Child Poverty Among Girls Under 16
In terms of child poverty among girls under 16, the demographic groups most similar to Immigrants from Colombia are Immigrants from Oceania (16.1%, a difference of 0.070%), Immigrants from Germany (16.1%, a difference of 0.070%), South American (16.1%, a difference of 0.090%), French Canadian (16.1%, a difference of 0.11%), and Uruguayan (16.2%, a difference of 0.41%).
| Demographics | Rating | Rank | Child Poverty Among Girls Under 16 |
| Colombians | 76.1 /100 | #157 | Good 15.9% |
| Guamanians/Chamorros | 75.3 /100 | #158 | Good 15.9% |
| Slovaks | 75.2 /100 | #159 | Good 15.9% |
| French | 72.8 /100 | #160 | Good 16.0% |
| Immigrants | Northern Africa | 72.0 /100 | #161 | Good 16.0% |
| French Canadians | 68.7 /100 | #162 | Good 16.1% |
| Immigrants | Oceania | 68.4 /100 | #163 | Good 16.1% |
| Immigrants | Colombia | 67.8 /100 | #164 | Good 16.1% |
| Immigrants | Germany | 67.3 /100 | #165 | Good 16.1% |
| South Americans | 67.2 /100 | #166 | Good 16.1% |
| Uruguayans | 64.7 /100 | #167 | Good 16.2% |
| Yugoslavians | 64.4 /100 | #168 | Good 16.2% |
| Costa Ricans | 64.2 /100 | #169 | Good 16.2% |
| Immigrants | Venezuela | 64.2 /100 | #170 | Good 16.2% |
| Immigrants | Saudi Arabia | 64.0 /100 | #171 | Good 16.2% |
Demographics Similar to Lumbee by Child Poverty Among Girls Under 16
In terms of child poverty among girls under 16, the demographic groups most similar to Lumbee are Navajo (30.5%, a difference of 0.78%), Tohono O'odham (31.6%, a difference of 2.9%), Immigrants from Yemen (29.5%, a difference of 4.1%), Puerto Rican (32.7%, a difference of 6.4%), and Pima (28.2%, a difference of 8.8%).
| Demographics | Rating | Rank | Child Poverty Among Girls Under 16 |
| Blacks/African Americans | 0.0 /100 | #333 | Tragic 24.7% |
| Menominee | 0.0 /100 | #334 | Tragic 25.0% |
| Pueblo | 0.0 /100 | #335 | Tragic 25.2% |
| Sioux | 0.0 /100 | #336 | Tragic 25.6% |
| Yup'ik | 0.0 /100 | #337 | Tragic 25.8% |
| Cheyenne | 0.0 /100 | #338 | Tragic 26.3% |
| Crow | 0.0 /100 | #339 | Tragic 26.4% |
| Yuman | 0.0 /100 | #340 | Tragic 27.1% |
| Hopi | 0.0 /100 | #341 | Tragic 27.9% |
| Pima | 0.0 /100 | #342 | Tragic 28.2% |
| Immigrants | Yemen | 0.0 /100 | #343 | Tragic 29.5% |
| Navajo | 0.0 /100 | #344 | Tragic 30.5% |
| Lumbee | 0.0 /100 | #345 | Tragic 30.7% |
| Tohono O'odham | 0.0 /100 | #346 | Tragic 31.6% |
| Puerto Ricans | 0.0 /100 | #347 | Tragic 32.7% |