Immigrants from Ethiopia vs Apache Single Father Poverty
COMPARE
Immigrants from Ethiopia
Apache
Single Father Poverty
Single Father Poverty Comparison
Immigrants from Ethiopia
Apache
13.4%
SINGLE FATHER POVERTY
100.0/ 100
METRIC RATING
5th/ 347
METRIC RANK
24.2%
SINGLE FATHER POVERTY
0.0/ 100
METRIC RATING
339th/ 347
METRIC RANK
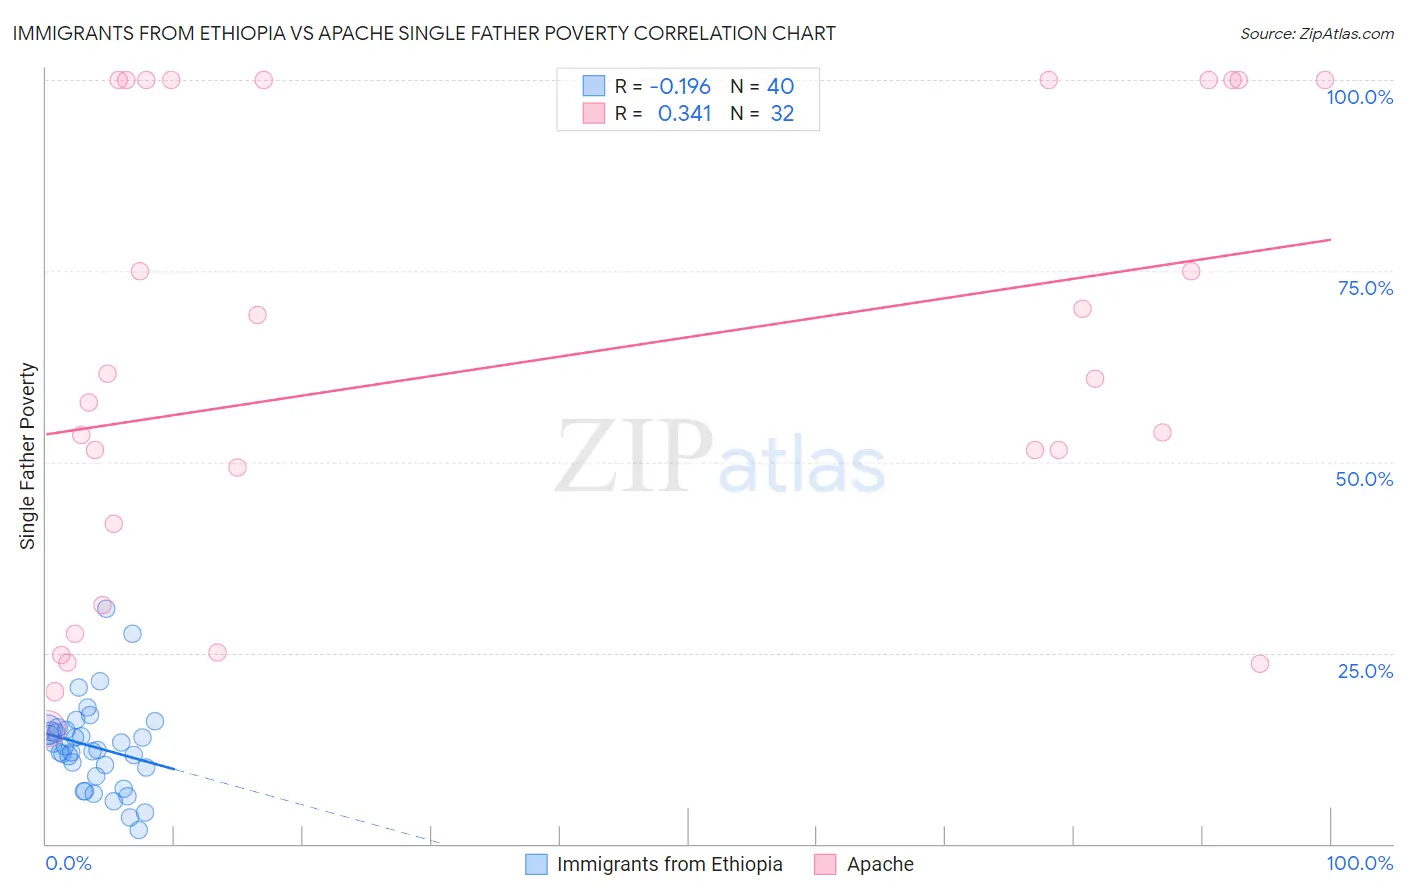
Immigrants from Ethiopia vs Apache Single Father Poverty Correlation Chart
The statistical analysis conducted on geographies consisting of 182,435,040 people shows a poor negative correlation between the proportion of Immigrants from Ethiopia and poverty level among single fathers in the United States with a correlation coefficient (R) of -0.196 and weighted average of 13.4%. Similarly, the statistical analysis conducted on geographies consisting of 199,792,986 people shows a mild positive correlation between the proportion of Apache and poverty level among single fathers in the United States with a correlation coefficient (R) of 0.341 and weighted average of 24.2%, a difference of 80.4%.
Single Father Poverty Correlation Summary
| Measurement | Immigrants from Ethiopia | Apache |
| Minimum | 1.7% | 15.1% |
| Maximum | 30.7% | 100.0% |
| Range | 29.0% | 84.9% |
| Mean | 12.7% | 62.9% |
| Median | 12.6% | 59.3% |
| Interquartile 25% (IQ1) | 9.4% | 36.6% |
| Interquartile 75% (IQ3) | 14.9% | 100.0% |
| Interquartile Range (IQR) | 5.5% | 63.4% |
| Standard Deviation (Sample) | 5.8% | 29.9% |
| Standard Deviation (Population) | 5.8% | 29.4% |
Similar Demographics by Single Father Poverty
Demographics Similar to Immigrants from Ethiopia by Single Father Poverty
In terms of single father poverty, the demographic groups most similar to Immigrants from Ethiopia are Ethiopian (13.5%, a difference of 0.77%), Immigrants from Fiji (13.2%, a difference of 1.6%), Immigrants from Taiwan (13.7%, a difference of 1.8%), Samoan (13.8%, a difference of 2.7%), and Afghan (14.0%, a difference of 3.8%).
| Demographics | Rating | Rank | Single Father Poverty |
| Assyrians/Chaldeans/Syriacs | 100.0 /100 | #1 | Exceptional 11.7% |
| Tongans | 100.0 /100 | #2 | Exceptional 12.2% |
| Tsimshian | 100.0 /100 | #3 | Exceptional 12.7% |
| Immigrants | Fiji | 100.0 /100 | #4 | Exceptional 13.2% |
| Immigrants | Ethiopia | 100.0 /100 | #5 | Exceptional 13.4% |
| Ethiopians | 100.0 /100 | #6 | Exceptional 13.5% |
| Immigrants | Taiwan | 100.0 /100 | #7 | Exceptional 13.7% |
| Samoans | 100.0 /100 | #8 | Exceptional 13.8% |
| Afghans | 100.0 /100 | #9 | Exceptional 14.0% |
| Koreans | 100.0 /100 | #10 | Exceptional 14.0% |
| Filipinos | 100.0 /100 | #11 | Exceptional 14.0% |
| Immigrants | India | 100.0 /100 | #12 | Exceptional 14.0% |
| Immigrants | Philippines | 100.0 /100 | #13 | Exceptional 14.0% |
| Immigrants | Vietnam | 100.0 /100 | #14 | Exceptional 14.1% |
| Sri Lankans | 100.0 /100 | #15 | Exceptional 14.2% |
Demographics Similar to Apache by Single Father Poverty
In terms of single father poverty, the demographic groups most similar to Apache are Arapaho (24.0%, a difference of 1.1%), Sioux (23.9%, a difference of 1.5%), Cajun (23.1%, a difference of 5.1%), Shoshone (22.9%, a difference of 5.8%), and Kiowa (22.5%, a difference of 7.9%).
| Demographics | Rating | Rank | Single Father Poverty |
| Tohono O'odham | 0.0 /100 | #332 | Tragic 22.0% |
| Natives/Alaskans | 0.0 /100 | #333 | Tragic 22.4% |
| Kiowa | 0.0 /100 | #334 | Tragic 22.5% |
| Shoshone | 0.0 /100 | #335 | Tragic 22.9% |
| Cajuns | 0.0 /100 | #336 | Tragic 23.1% |
| Sioux | 0.0 /100 | #337 | Tragic 23.9% |
| Arapaho | 0.0 /100 | #338 | Tragic 24.0% |
| Apache | 0.0 /100 | #339 | Tragic 24.2% |
| Houma | 0.0 /100 | #340 | Tragic 26.7% |
| Hopi | 0.0 /100 | #341 | Tragic 27.2% |
| Yuman | 0.0 /100 | #342 | Tragic 28.4% |
| Lumbee | 0.0 /100 | #343 | Tragic 28.5% |
| Navajo | 0.0 /100 | #344 | Tragic 29.2% |
| Crow | 0.0 /100 | #345 | Tragic 30.3% |
| Puerto Ricans | 0.0 /100 | #346 | Tragic 31.5% |