Spanish vs Apache Single Father Poverty
COMPARE
Spanish
Apache
Single Father Poverty
Single Father Poverty Comparison
Spanish
Apache
16.7%
SINGLE FATHER POVERTY
10.7/ 100
METRIC RATING
214th/ 347
METRIC RANK
24.2%
SINGLE FATHER POVERTY
0.0/ 100
METRIC RATING
339th/ 347
METRIC RANK
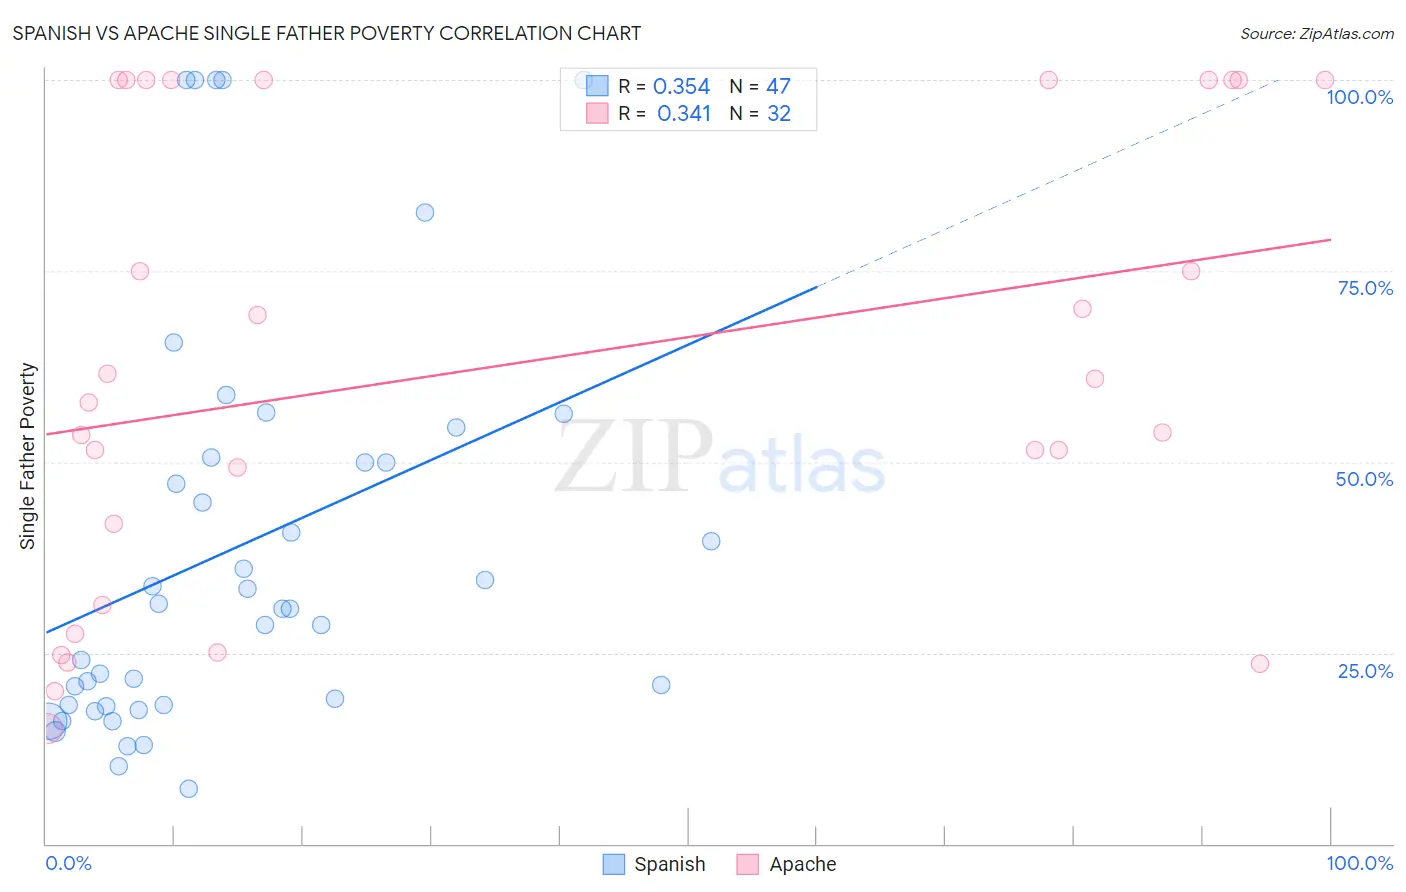
Spanish vs Apache Single Father Poverty Correlation Chart
The statistical analysis conducted on geographies consisting of 330,244,668 people shows a mild positive correlation between the proportion of Spanish and poverty level among single fathers in the United States with a correlation coefficient (R) of 0.354 and weighted average of 16.7%. Similarly, the statistical analysis conducted on geographies consisting of 199,792,986 people shows a mild positive correlation between the proportion of Apache and poverty level among single fathers in the United States with a correlation coefficient (R) of 0.341 and weighted average of 24.2%, a difference of 45.4%.
Single Father Poverty Correlation Summary
| Measurement | Spanish | Apache |
| Minimum | 7.2% | 15.1% |
| Maximum | 100.0% | 100.0% |
| Range | 92.8% | 84.9% |
| Mean | 38.9% | 62.9% |
| Median | 30.8% | 59.3% |
| Interquartile 25% (IQ1) | 18.1% | 36.6% |
| Interquartile 75% (IQ3) | 50.5% | 100.0% |
| Interquartile Range (IQR) | 32.4% | 63.4% |
| Standard Deviation (Sample) | 26.9% | 29.9% |
| Standard Deviation (Population) | 26.6% | 29.4% |
Similar Demographics by Single Father Poverty
Demographics Similar to Spanish by Single Father Poverty
In terms of single father poverty, the demographic groups most similar to Spanish are Ghanaian (16.7%, a difference of 0.040%), Immigrants from Southern Europe (16.7%, a difference of 0.050%), Immigrants from Scotland (16.7%, a difference of 0.13%), Immigrants from England (16.7%, a difference of 0.14%), and Cheyenne (16.7%, a difference of 0.17%).
| Demographics | Rating | Rank | Single Father Poverty |
| New Zealanders | 13.7 /100 | #207 | Poor 16.6% |
| Eastern Europeans | 13.7 /100 | #208 | Poor 16.6% |
| Europeans | 13.2 /100 | #209 | Poor 16.6% |
| Guatemalans | 12.9 /100 | #210 | Poor 16.6% |
| Arabs | 12.8 /100 | #211 | Poor 16.6% |
| Immigrants | Southern Europe | 11.2 /100 | #212 | Poor 16.7% |
| Ghanaians | 11.0 /100 | #213 | Poor 16.7% |
| Spanish | 10.7 /100 | #214 | Poor 16.7% |
| Immigrants | Scotland | 9.6 /100 | #215 | Tragic 16.7% |
| Immigrants | England | 9.5 /100 | #216 | Tragic 16.7% |
| Cheyenne | 9.3 /100 | #217 | Tragic 16.7% |
| Immigrants | Uganda | 8.6 /100 | #218 | Tragic 16.7% |
| Immigrants | Ghana | 8.1 /100 | #219 | Tragic 16.7% |
| Immigrants | Denmark | 8.1 /100 | #220 | Tragic 16.7% |
| Immigrants | Greece | 8.1 /100 | #221 | Tragic 16.7% |
Demographics Similar to Apache by Single Father Poverty
In terms of single father poverty, the demographic groups most similar to Apache are Arapaho (24.0%, a difference of 1.1%), Sioux (23.9%, a difference of 1.5%), Cajun (23.1%, a difference of 5.1%), Shoshone (22.9%, a difference of 5.8%), and Kiowa (22.5%, a difference of 7.9%).
| Demographics | Rating | Rank | Single Father Poverty |
| Tohono O'odham | 0.0 /100 | #332 | Tragic 22.0% |
| Natives/Alaskans | 0.0 /100 | #333 | Tragic 22.4% |
| Kiowa | 0.0 /100 | #334 | Tragic 22.5% |
| Shoshone | 0.0 /100 | #335 | Tragic 22.9% |
| Cajuns | 0.0 /100 | #336 | Tragic 23.1% |
| Sioux | 0.0 /100 | #337 | Tragic 23.9% |
| Arapaho | 0.0 /100 | #338 | Tragic 24.0% |
| Apache | 0.0 /100 | #339 | Tragic 24.2% |
| Houma | 0.0 /100 | #340 | Tragic 26.7% |
| Hopi | 0.0 /100 | #341 | Tragic 27.2% |
| Yuman | 0.0 /100 | #342 | Tragic 28.4% |
| Lumbee | 0.0 /100 | #343 | Tragic 28.5% |
| Navajo | 0.0 /100 | #344 | Tragic 29.2% |
| Crow | 0.0 /100 | #345 | Tragic 30.3% |
| Puerto Ricans | 0.0 /100 | #346 | Tragic 31.5% |