Immigrants from Ethiopia vs Spanish Single Father Poverty
COMPARE
Immigrants from Ethiopia
Spanish
Single Father Poverty
Single Father Poverty Comparison
Immigrants from Ethiopia
Spanish
13.4%
SINGLE FATHER POVERTY
100.0/ 100
METRIC RATING
5th/ 347
METRIC RANK
16.7%
SINGLE FATHER POVERTY
10.7/ 100
METRIC RATING
214th/ 347
METRIC RANK
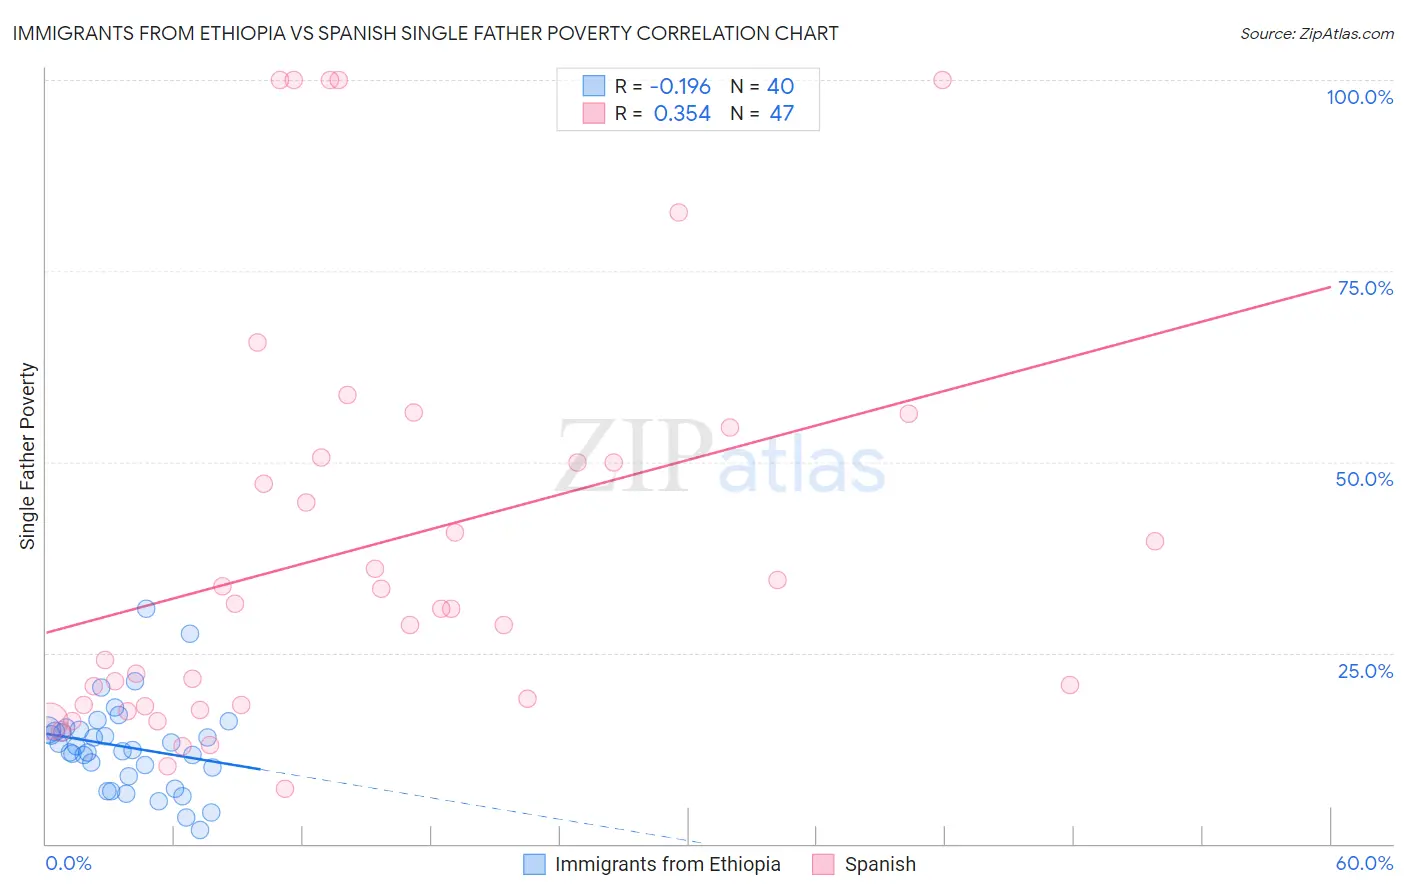
Immigrants from Ethiopia vs Spanish Single Father Poverty Correlation Chart
The statistical analysis conducted on geographies consisting of 182,435,040 people shows a poor negative correlation between the proportion of Immigrants from Ethiopia and poverty level among single fathers in the United States with a correlation coefficient (R) of -0.196 and weighted average of 13.4%. Similarly, the statistical analysis conducted on geographies consisting of 330,244,668 people shows a mild positive correlation between the proportion of Spanish and poverty level among single fathers in the United States with a correlation coefficient (R) of 0.354 and weighted average of 16.7%, a difference of 24.1%.
Single Father Poverty Correlation Summary
| Measurement | Immigrants from Ethiopia | Spanish |
| Minimum | 1.7% | 7.2% |
| Maximum | 30.7% | 100.0% |
| Range | 29.0% | 92.8% |
| Mean | 12.7% | 38.9% |
| Median | 12.6% | 30.8% |
| Interquartile 25% (IQ1) | 9.4% | 18.1% |
| Interquartile 75% (IQ3) | 14.9% | 50.5% |
| Interquartile Range (IQR) | 5.5% | 32.4% |
| Standard Deviation (Sample) | 5.8% | 26.9% |
| Standard Deviation (Population) | 5.8% | 26.6% |
Similar Demographics by Single Father Poverty
Demographics Similar to Immigrants from Ethiopia by Single Father Poverty
In terms of single father poverty, the demographic groups most similar to Immigrants from Ethiopia are Ethiopian (13.5%, a difference of 0.77%), Immigrants from Fiji (13.2%, a difference of 1.6%), Immigrants from Taiwan (13.7%, a difference of 1.8%), Samoan (13.8%, a difference of 2.7%), and Afghan (14.0%, a difference of 3.8%).
| Demographics | Rating | Rank | Single Father Poverty |
| Assyrians/Chaldeans/Syriacs | 100.0 /100 | #1 | Exceptional 11.7% |
| Tongans | 100.0 /100 | #2 | Exceptional 12.2% |
| Tsimshian | 100.0 /100 | #3 | Exceptional 12.7% |
| Immigrants | Fiji | 100.0 /100 | #4 | Exceptional 13.2% |
| Immigrants | Ethiopia | 100.0 /100 | #5 | Exceptional 13.4% |
| Ethiopians | 100.0 /100 | #6 | Exceptional 13.5% |
| Immigrants | Taiwan | 100.0 /100 | #7 | Exceptional 13.7% |
| Samoans | 100.0 /100 | #8 | Exceptional 13.8% |
| Afghans | 100.0 /100 | #9 | Exceptional 14.0% |
| Koreans | 100.0 /100 | #10 | Exceptional 14.0% |
| Filipinos | 100.0 /100 | #11 | Exceptional 14.0% |
| Immigrants | India | 100.0 /100 | #12 | Exceptional 14.0% |
| Immigrants | Philippines | 100.0 /100 | #13 | Exceptional 14.0% |
| Immigrants | Vietnam | 100.0 /100 | #14 | Exceptional 14.1% |
| Sri Lankans | 100.0 /100 | #15 | Exceptional 14.2% |
Demographics Similar to Spanish by Single Father Poverty
In terms of single father poverty, the demographic groups most similar to Spanish are Ghanaian (16.7%, a difference of 0.040%), Immigrants from Southern Europe (16.7%, a difference of 0.050%), Immigrants from Scotland (16.7%, a difference of 0.13%), Immigrants from England (16.7%, a difference of 0.14%), and Cheyenne (16.7%, a difference of 0.17%).
| Demographics | Rating | Rank | Single Father Poverty |
| New Zealanders | 13.7 /100 | #207 | Poor 16.6% |
| Eastern Europeans | 13.7 /100 | #208 | Poor 16.6% |
| Europeans | 13.2 /100 | #209 | Poor 16.6% |
| Guatemalans | 12.9 /100 | #210 | Poor 16.6% |
| Arabs | 12.8 /100 | #211 | Poor 16.6% |
| Immigrants | Southern Europe | 11.2 /100 | #212 | Poor 16.7% |
| Ghanaians | 11.0 /100 | #213 | Poor 16.7% |
| Spanish | 10.7 /100 | #214 | Poor 16.7% |
| Immigrants | Scotland | 9.6 /100 | #215 | Tragic 16.7% |
| Immigrants | England | 9.5 /100 | #216 | Tragic 16.7% |
| Cheyenne | 9.3 /100 | #217 | Tragic 16.7% |
| Immigrants | Uganda | 8.6 /100 | #218 | Tragic 16.7% |
| Immigrants | Ghana | 8.1 /100 | #219 | Tragic 16.7% |
| Immigrants | Denmark | 8.1 /100 | #220 | Tragic 16.7% |
| Immigrants | Greece | 8.1 /100 | #221 | Tragic 16.7% |