Immigrants from Poland vs Apache Single Father Poverty
COMPARE
Immigrants from Poland
Apache
Single Father Poverty
Single Father Poverty Comparison
Immigrants from Poland
Apache
15.7%
SINGLE FATHER POVERTY
95.8/ 100
METRIC RATING
106th/ 347
METRIC RANK
24.2%
SINGLE FATHER POVERTY
0.0/ 100
METRIC RATING
339th/ 347
METRIC RANK
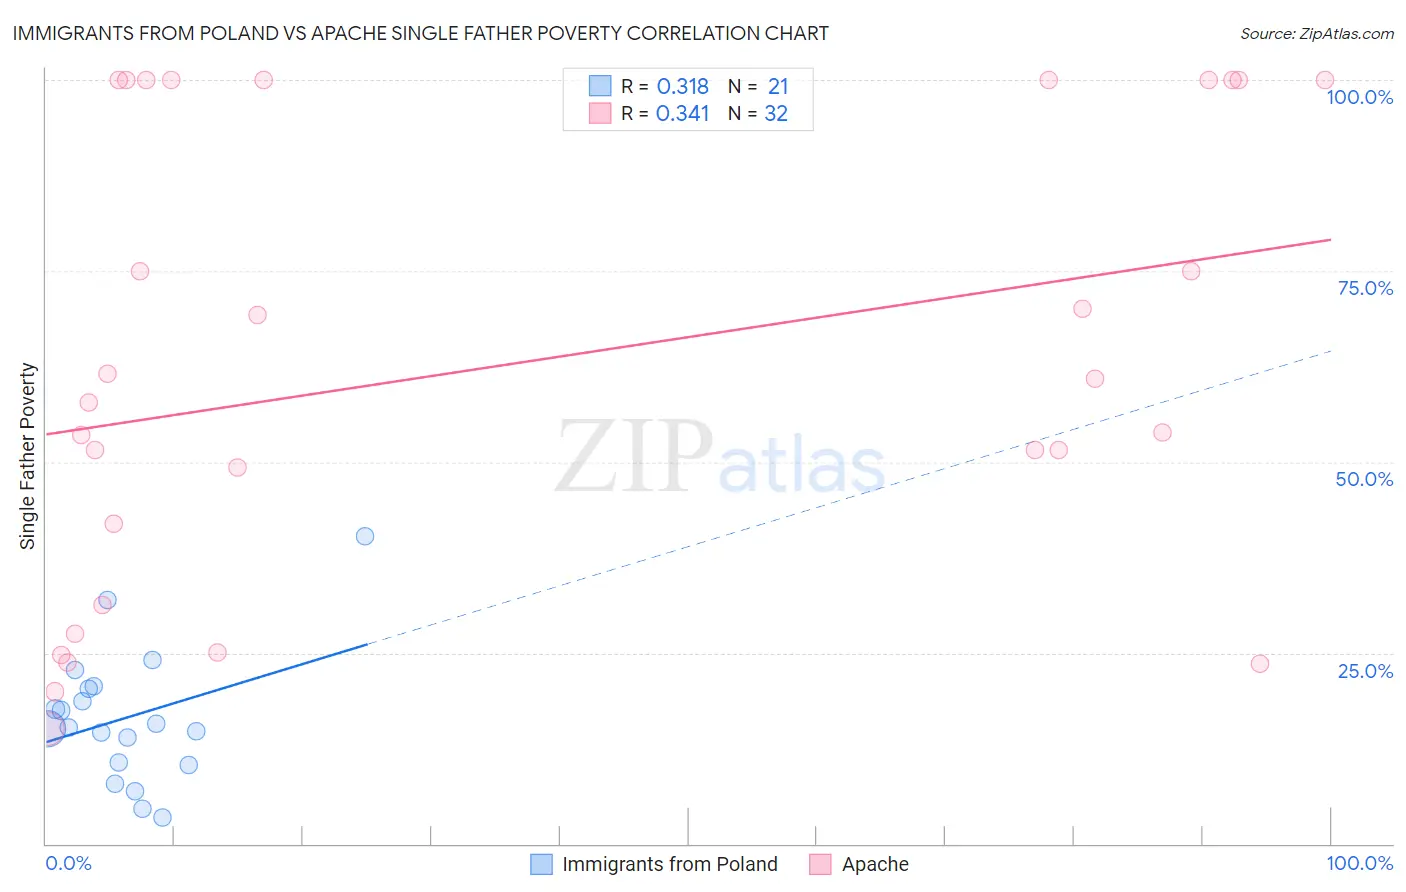
Immigrants from Poland vs Apache Single Father Poverty Correlation Chart
The statistical analysis conducted on geographies consisting of 239,246,300 people shows a mild positive correlation between the proportion of Immigrants from Poland and poverty level among single fathers in the United States with a correlation coefficient (R) of 0.318 and weighted average of 15.7%. Similarly, the statistical analysis conducted on geographies consisting of 199,792,986 people shows a mild positive correlation between the proportion of Apache and poverty level among single fathers in the United States with a correlation coefficient (R) of 0.341 and weighted average of 24.2%, a difference of 54.1%.
Single Father Poverty Correlation Summary
| Measurement | Immigrants from Poland | Apache |
| Minimum | 3.5% | 15.1% |
| Maximum | 40.3% | 100.0% |
| Range | 36.8% | 84.9% |
| Mean | 16.5% | 62.9% |
| Median | 15.2% | 59.3% |
| Interquartile 25% (IQ1) | 10.5% | 36.6% |
| Interquartile 75% (IQ3) | 20.5% | 100.0% |
| Interquartile Range (IQR) | 10.0% | 63.4% |
| Standard Deviation (Sample) | 8.7% | 29.9% |
| Standard Deviation (Population) | 8.5% | 29.4% |
Similar Demographics by Single Father Poverty
Demographics Similar to Immigrants from Poland by Single Father Poverty
In terms of single father poverty, the demographic groups most similar to Immigrants from Poland are Native Hawaiian (15.7%, a difference of 0.020%), Pakistani (15.7%, a difference of 0.030%), Immigrants from Australia (15.7%, a difference of 0.070%), Australian (15.7%, a difference of 0.080%), and South American Indian (15.7%, a difference of 0.11%).
| Demographics | Rating | Rank | Single Father Poverty |
| Immigrants | Middle Africa | 97.4 /100 | #99 | Exceptional 15.6% |
| Immigrants | Chile | 96.9 /100 | #100 | Exceptional 15.7% |
| Fijians | 96.8 /100 | #101 | Exceptional 15.7% |
| Chileans | 96.4 /100 | #102 | Exceptional 15.7% |
| South American Indians | 96.2 /100 | #103 | Exceptional 15.7% |
| Australians | 96.1 /100 | #104 | Exceptional 15.7% |
| Immigrants | Australia | 96.1 /100 | #105 | Exceptional 15.7% |
| Immigrants | Poland | 95.8 /100 | #106 | Exceptional 15.7% |
| Native Hawaiians | 95.8 /100 | #107 | Exceptional 15.7% |
| Pakistanis | 95.7 /100 | #108 | Exceptional 15.7% |
| Turks | 95.1 /100 | #109 | Exceptional 15.8% |
| Immigrants | Africa | 95.1 /100 | #110 | Exceptional 15.8% |
| Bulgarians | 94.8 /100 | #111 | Exceptional 15.8% |
| Immigrants | Latvia | 94.7 /100 | #112 | Exceptional 15.8% |
| Danes | 94.5 /100 | #113 | Exceptional 15.8% |
Demographics Similar to Apache by Single Father Poverty
In terms of single father poverty, the demographic groups most similar to Apache are Arapaho (24.0%, a difference of 1.1%), Sioux (23.9%, a difference of 1.5%), Cajun (23.1%, a difference of 5.1%), Shoshone (22.9%, a difference of 5.8%), and Kiowa (22.5%, a difference of 7.9%).
| Demographics | Rating | Rank | Single Father Poverty |
| Tohono O'odham | 0.0 /100 | #332 | Tragic 22.0% |
| Natives/Alaskans | 0.0 /100 | #333 | Tragic 22.4% |
| Kiowa | 0.0 /100 | #334 | Tragic 22.5% |
| Shoshone | 0.0 /100 | #335 | Tragic 22.9% |
| Cajuns | 0.0 /100 | #336 | Tragic 23.1% |
| Sioux | 0.0 /100 | #337 | Tragic 23.9% |
| Arapaho | 0.0 /100 | #338 | Tragic 24.0% |
| Apache | 0.0 /100 | #339 | Tragic 24.2% |
| Houma | 0.0 /100 | #340 | Tragic 26.7% |
| Hopi | 0.0 /100 | #341 | Tragic 27.2% |
| Yuman | 0.0 /100 | #342 | Tragic 28.4% |
| Lumbee | 0.0 /100 | #343 | Tragic 28.5% |
| Navajo | 0.0 /100 | #344 | Tragic 29.2% |
| Crow | 0.0 /100 | #345 | Tragic 30.3% |
| Puerto Ricans | 0.0 /100 | #346 | Tragic 31.5% |