Vietnamese vs Apache Single Father Poverty
COMPARE
Vietnamese
Apache
Single Father Poverty
Single Father Poverty Comparison
Vietnamese
Apache
16.3%
SINGLE FATHER POVERTY
48.0/ 100
METRIC RATING
176th/ 347
METRIC RANK
24.2%
SINGLE FATHER POVERTY
0.0/ 100
METRIC RATING
339th/ 347
METRIC RANK
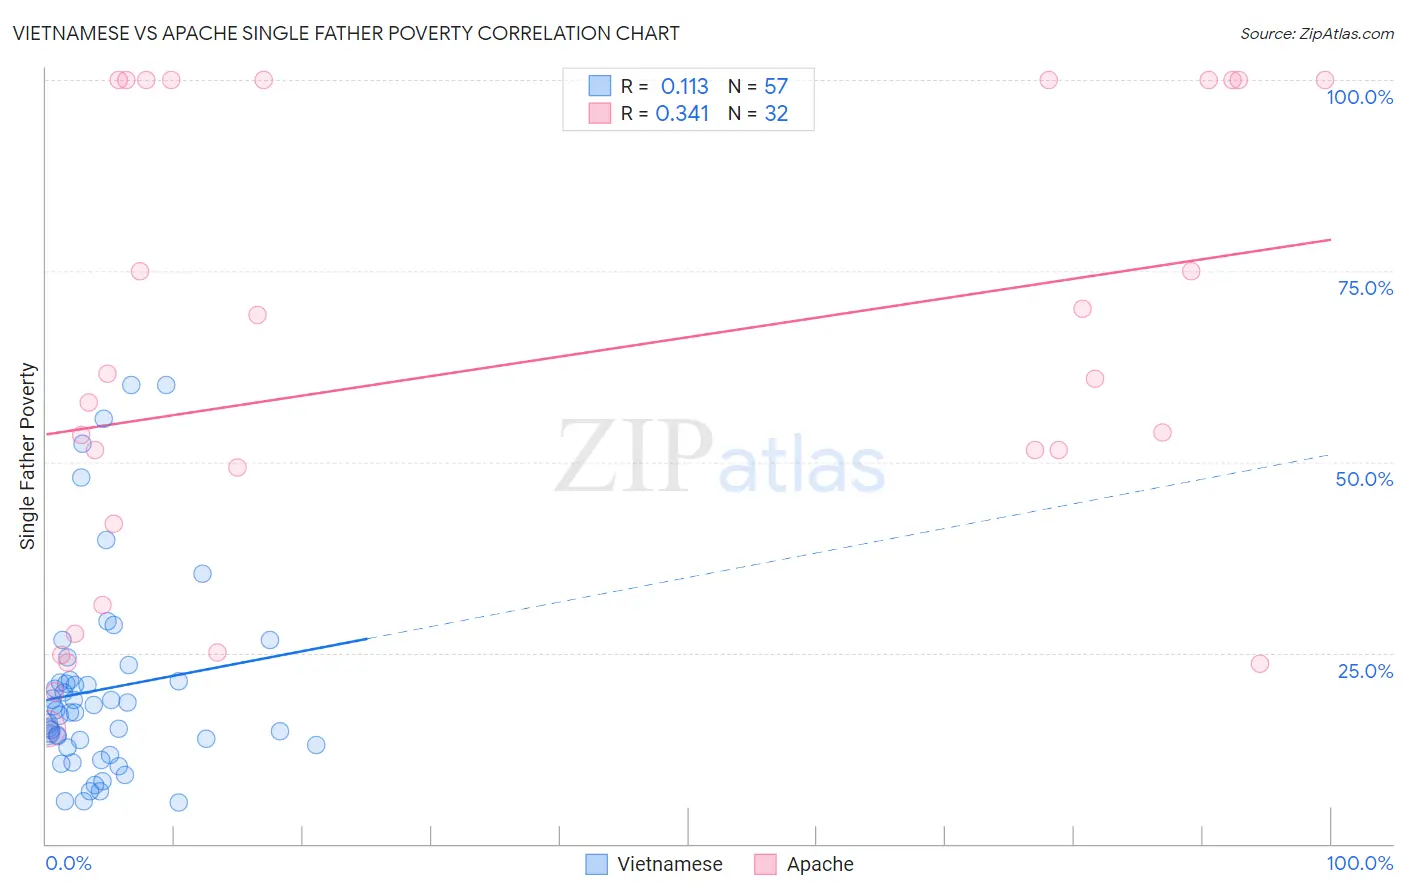
Vietnamese vs Apache Single Father Poverty Correlation Chart
The statistical analysis conducted on geographies consisting of 147,063,845 people shows a poor positive correlation between the proportion of Vietnamese and poverty level among single fathers in the United States with a correlation coefficient (R) of 0.113 and weighted average of 16.3%. Similarly, the statistical analysis conducted on geographies consisting of 199,792,986 people shows a mild positive correlation between the proportion of Apache and poverty level among single fathers in the United States with a correlation coefficient (R) of 0.341 and weighted average of 24.2%, a difference of 48.7%.
Single Father Poverty Correlation Summary
| Measurement | Vietnamese | Apache |
| Minimum | 5.4% | 15.1% |
| Maximum | 60.0% | 100.0% |
| Range | 54.6% | 84.9% |
| Mean | 20.2% | 62.9% |
| Median | 17.2% | 59.3% |
| Interquartile 25% (IQ1) | 12.7% | 36.6% |
| Interquartile 75% (IQ3) | 21.4% | 100.0% |
| Interquartile Range (IQR) | 8.6% | 63.4% |
| Standard Deviation (Sample) | 13.0% | 29.9% |
| Standard Deviation (Population) | 12.9% | 29.4% |
Similar Demographics by Single Father Poverty
Demographics Similar to Vietnamese by Single Father Poverty
In terms of single father poverty, the demographic groups most similar to Vietnamese are Immigrants from Ecuador (16.3%, a difference of 0.070%), Immigrants from Sierra Leone (16.3%, a difference of 0.090%), Immigrants from St. Vincent and the Grenadines (16.3%, a difference of 0.090%), Swedish (16.3%, a difference of 0.090%), and Immigrants from Morocco (16.3%, a difference of 0.12%).
| Demographics | Rating | Rank | Single Father Poverty |
| Northern Europeans | 52.8 /100 | #169 | Average 16.3% |
| Scandinavians | 52.3 /100 | #170 | Average 16.3% |
| Immigrants | Morocco | 50.7 /100 | #171 | Average 16.3% |
| Immigrants | Sierra Leone | 50.1 /100 | #172 | Average 16.3% |
| Immigrants | St. Vincent and the Grenadines | 50.0 /100 | #173 | Average 16.3% |
| Swedes | 50.0 /100 | #174 | Average 16.3% |
| Immigrants | Ecuador | 49.7 /100 | #175 | Average 16.3% |
| Vietnamese | 48.0 /100 | #176 | Average 16.3% |
| Immigrants | South Africa | 44.2 /100 | #177 | Average 16.3% |
| Immigrants | Cuba | 41.6 /100 | #178 | Average 16.4% |
| Serbians | 40.9 /100 | #179 | Average 16.4% |
| Immigrants | Latin America | 37.2 /100 | #180 | Fair 16.4% |
| Immigrants | Western Africa | 36.0 /100 | #181 | Fair 16.4% |
| Immigrants | Italy | 35.7 /100 | #182 | Fair 16.4% |
| Aleuts | 35.3 /100 | #183 | Fair 16.4% |
Demographics Similar to Apache by Single Father Poverty
In terms of single father poverty, the demographic groups most similar to Apache are Arapaho (24.0%, a difference of 1.1%), Sioux (23.9%, a difference of 1.5%), Cajun (23.1%, a difference of 5.1%), Shoshone (22.9%, a difference of 5.8%), and Kiowa (22.5%, a difference of 7.9%).
| Demographics | Rating | Rank | Single Father Poverty |
| Tohono O'odham | 0.0 /100 | #332 | Tragic 22.0% |
| Natives/Alaskans | 0.0 /100 | #333 | Tragic 22.4% |
| Kiowa | 0.0 /100 | #334 | Tragic 22.5% |
| Shoshone | 0.0 /100 | #335 | Tragic 22.9% |
| Cajuns | 0.0 /100 | #336 | Tragic 23.1% |
| Sioux | 0.0 /100 | #337 | Tragic 23.9% |
| Arapaho | 0.0 /100 | #338 | Tragic 24.0% |
| Apache | 0.0 /100 | #339 | Tragic 24.2% |
| Houma | 0.0 /100 | #340 | Tragic 26.7% |
| Hopi | 0.0 /100 | #341 | Tragic 27.2% |
| Yuman | 0.0 /100 | #342 | Tragic 28.4% |
| Lumbee | 0.0 /100 | #343 | Tragic 28.5% |
| Navajo | 0.0 /100 | #344 | Tragic 29.2% |
| Crow | 0.0 /100 | #345 | Tragic 30.3% |
| Puerto Ricans | 0.0 /100 | #346 | Tragic 31.5% |