Immigrants from Ecuador vs Immigrants from Liberia Child Poverty Among Girls Under 16
COMPARE
Immigrants from Ecuador
Immigrants from Liberia
Child Poverty Among Girls Under 16
Child Poverty Among Girls Under 16 Comparison
Immigrants from Ecuador
Immigrants from Liberia
19.3%
CHILD POVERTY AMONG GIRLS UNDER 16
0.3/ 100
METRIC RATING
255th/ 347
METRIC RANK
20.2%
CHILD POVERTY AMONG GIRLS UNDER 16
0.0/ 100
METRIC RATING
280th/ 347
METRIC RANK
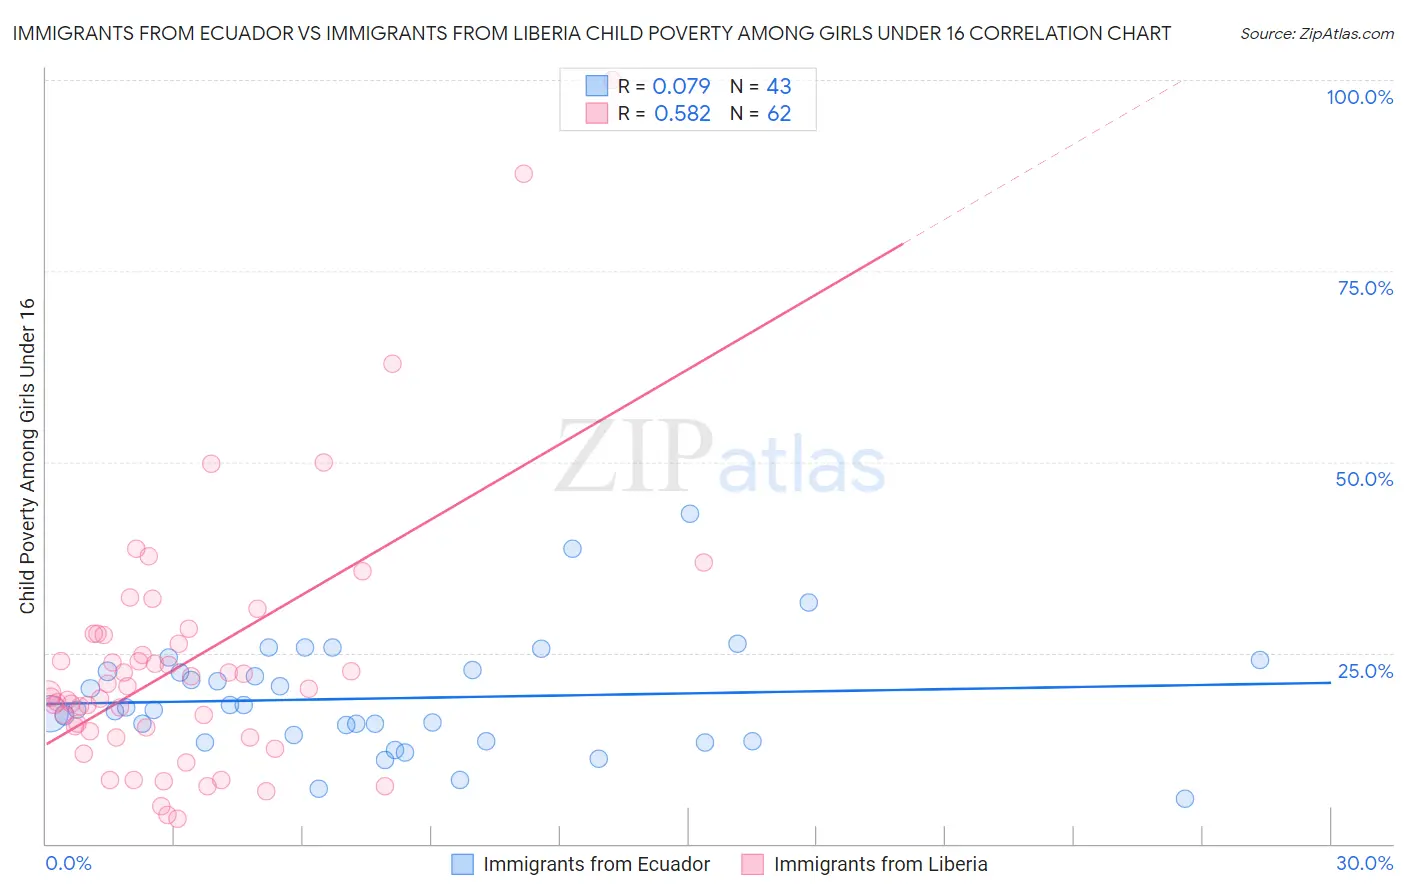
Immigrants from Ecuador vs Immigrants from Liberia Child Poverty Among Girls Under 16 Correlation Chart
The statistical analysis conducted on geographies consisting of 267,531,400 people shows a slight positive correlation between the proportion of Immigrants from Ecuador and poverty level among girls under the age of 16 in the United States with a correlation coefficient (R) of 0.079 and weighted average of 19.3%. Similarly, the statistical analysis conducted on geographies consisting of 134,725,271 people shows a substantial positive correlation between the proportion of Immigrants from Liberia and poverty level among girls under the age of 16 in the United States with a correlation coefficient (R) of 0.582 and weighted average of 20.2%, a difference of 4.9%.
Child Poverty Among Girls Under 16 Correlation Summary
| Measurement | Immigrants from Ecuador | Immigrants from Liberia |
| Minimum | 5.9% | 3.2% |
| Maximum | 43.2% | 100.0% |
| Range | 37.3% | 96.8% |
| Mean | 19.0% | 23.5% |
| Median | 17.6% | 20.0% |
| Interquartile 25% (IQ1) | 13.4% | 14.7% |
| Interquartile 75% (IQ3) | 22.8% | 27.4% |
| Interquartile Range (IQR) | 9.4% | 12.7% |
| Standard Deviation (Sample) | 7.5% | 17.2% |
| Standard Deviation (Population) | 7.4% | 17.1% |
Similar Demographics by Child Poverty Among Girls Under 16
Demographics Similar to Immigrants from Ecuador by Child Poverty Among Girls Under 16
In terms of child poverty among girls under 16, the demographic groups most similar to Immigrants from Ecuador are Immigrants from Western Africa (19.3%, a difference of 0.020%), Trinidadian and Tobagonian (19.3%, a difference of 0.060%), Immigrants from Guyana (19.3%, a difference of 0.080%), Immigrants from Middle Africa (19.2%, a difference of 0.28%), and Immigrants from Trinidad and Tobago (19.2%, a difference of 0.31%).
| Demographics | Rating | Rank | Child Poverty Among Girls Under 16 |
| French American Indians | 0.3 /100 | #248 | Tragic 19.2% |
| Potawatomi | 0.3 /100 | #249 | Tragic 19.2% |
| Cape Verdeans | 0.3 /100 | #250 | Tragic 19.2% |
| Immigrants | Trinidad and Tobago | 0.3 /100 | #251 | Tragic 19.2% |
| Immigrants | Middle Africa | 0.3 /100 | #252 | Tragic 19.2% |
| Immigrants | Guyana | 0.3 /100 | #253 | Tragic 19.3% |
| Immigrants | Western Africa | 0.3 /100 | #254 | Tragic 19.3% |
| Immigrants | Ecuador | 0.3 /100 | #255 | Tragic 19.3% |
| Trinidadians and Tobagonians | 0.2 /100 | #256 | Tragic 19.3% |
| Guyanese | 0.2 /100 | #257 | Tragic 19.4% |
| Salvadorans | 0.2 /100 | #258 | Tragic 19.4% |
| Ottawa | 0.2 /100 | #259 | Tragic 19.4% |
| Mexican American Indians | 0.2 /100 | #260 | Tragic 19.5% |
| Vietnamese | 0.2 /100 | #261 | Tragic 19.5% |
| Chickasaw | 0.1 /100 | #262 | Tragic 19.6% |
Demographics Similar to Immigrants from Liberia by Child Poverty Among Girls Under 16
In terms of child poverty among girls under 16, the demographic groups most similar to Immigrants from Liberia are Immigrants from Zaire (20.2%, a difference of 0.010%), Central American (20.2%, a difference of 0.070%), Barbadian (20.2%, a difference of 0.14%), Belizean (20.2%, a difference of 0.17%), and Comanche (20.2%, a difference of 0.28%).
| Demographics | Rating | Rank | Child Poverty Among Girls Under 16 |
| Bangladeshis | 0.1 /100 | #273 | Tragic 20.0% |
| Immigrants | St. Vincent and the Grenadines | 0.0 /100 | #274 | Tragic 20.1% |
| Sub-Saharan Africans | 0.0 /100 | #275 | Tragic 20.1% |
| Comanche | 0.0 /100 | #276 | Tragic 20.2% |
| Belizeans | 0.0 /100 | #277 | Tragic 20.2% |
| Barbadians | 0.0 /100 | #278 | Tragic 20.2% |
| Immigrants | Zaire | 0.0 /100 | #279 | Tragic 20.2% |
| Immigrants | Liberia | 0.0 /100 | #280 | Tragic 20.2% |
| Central Americans | 0.0 /100 | #281 | Tragic 20.2% |
| West Indians | 0.0 /100 | #282 | Tragic 20.3% |
| Senegalese | 0.0 /100 | #283 | Tragic 20.3% |
| Yaqui | 0.0 /100 | #284 | Tragic 20.3% |
| Immigrants | Cabo Verde | 0.0 /100 | #285 | Tragic 20.3% |
| Iroquois | 0.0 /100 | #286 | Tragic 20.4% |
| Blackfeet | 0.0 /100 | #287 | Tragic 20.5% |