Immigrants from Ecuador vs Bangladeshi Child Poverty Among Girls Under 16
COMPARE
Immigrants from Ecuador
Bangladeshi
Child Poverty Among Girls Under 16
Child Poverty Among Girls Under 16 Comparison
Immigrants from Ecuador
Bangladeshis
19.3%
CHILD POVERTY AMONG GIRLS UNDER 16
0.3/ 100
METRIC RATING
255th/ 347
METRIC RANK
20.0%
CHILD POVERTY AMONG GIRLS UNDER 16
0.1/ 100
METRIC RATING
273rd/ 347
METRIC RANK
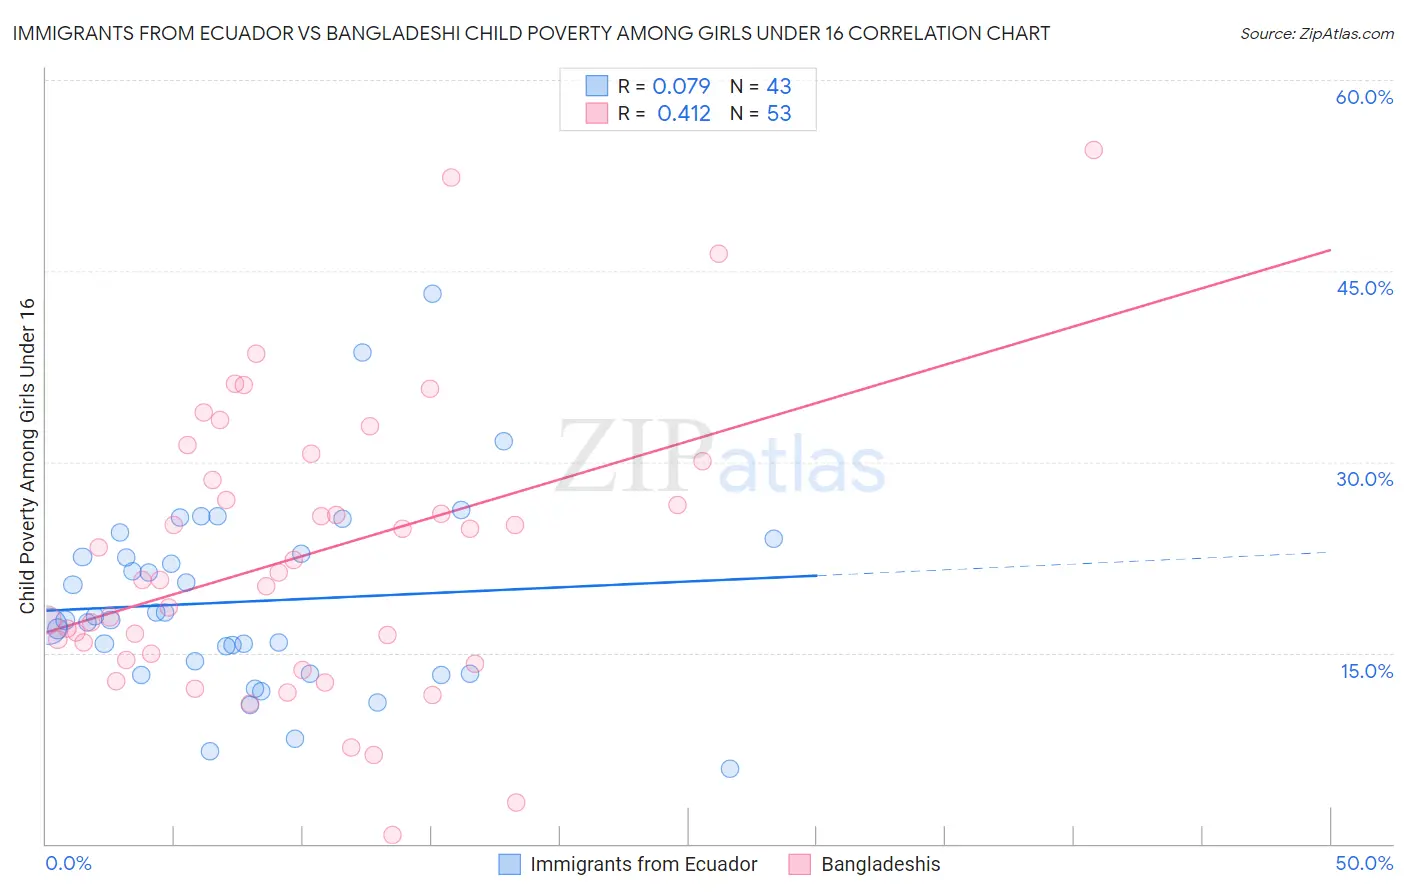
Immigrants from Ecuador vs Bangladeshi Child Poverty Among Girls Under 16 Correlation Chart
The statistical analysis conducted on geographies consisting of 267,531,400 people shows a slight positive correlation between the proportion of Immigrants from Ecuador and poverty level among girls under the age of 16 in the United States with a correlation coefficient (R) of 0.079 and weighted average of 19.3%. Similarly, the statistical analysis conducted on geographies consisting of 140,467,619 people shows a moderate positive correlation between the proportion of Bangladeshis and poverty level among girls under the age of 16 in the United States with a correlation coefficient (R) of 0.412 and weighted average of 20.0%, a difference of 3.6%.
Child Poverty Among Girls Under 16 Correlation Summary
| Measurement | Immigrants from Ecuador | Bangladeshi |
| Minimum | 5.9% | 0.72% |
| Maximum | 43.2% | 54.5% |
| Range | 37.3% | 53.8% |
| Mean | 19.0% | 22.6% |
| Median | 17.6% | 20.7% |
| Interquartile 25% (IQ1) | 13.4% | 14.7% |
| Interquartile 75% (IQ3) | 22.8% | 29.3% |
| Interquartile Range (IQR) | 9.4% | 14.6% |
| Standard Deviation (Sample) | 7.5% | 11.2% |
| Standard Deviation (Population) | 7.4% | 11.1% |
Demographics Similar to Immigrants from Ecuador and Bangladeshis by Child Poverty Among Girls Under 16
In terms of child poverty among girls under 16, the demographic groups most similar to Immigrants from Ecuador are Immigrants from Western Africa (19.3%, a difference of 0.020%), Trinidadian and Tobagonian (19.3%, a difference of 0.060%), Guyanese (19.4%, a difference of 0.31%), Salvadoran (19.4%, a difference of 0.44%), and Ottawa (19.4%, a difference of 0.54%). Similarly, the demographic groups most similar to Bangladeshis are Immigrants from El Salvador (20.0%, a difference of 0.20%), Immigrants from Barbados (19.9%, a difference of 0.31%), Cherokee (19.9%, a difference of 0.41%), Immigrants from St. Vincent and the Grenadines (20.1%, a difference of 0.42%), and Liberian (19.9%, a difference of 0.60%).
| Demographics | Rating | Rank | Child Poverty Among Girls Under 16 |
| Immigrants | Western Africa | 0.3 /100 | #254 | Tragic 19.3% |
| Immigrants | Ecuador | 0.3 /100 | #255 | Tragic 19.3% |
| Trinidadians and Tobagonians | 0.2 /100 | #256 | Tragic 19.3% |
| Guyanese | 0.2 /100 | #257 | Tragic 19.4% |
| Salvadorans | 0.2 /100 | #258 | Tragic 19.4% |
| Ottawa | 0.2 /100 | #259 | Tragic 19.4% |
| Mexican American Indians | 0.2 /100 | #260 | Tragic 19.5% |
| Vietnamese | 0.2 /100 | #261 | Tragic 19.5% |
| Chickasaw | 0.1 /100 | #262 | Tragic 19.6% |
| Immigrants | Burma/Myanmar | 0.1 /100 | #263 | Tragic 19.7% |
| Jamaicans | 0.1 /100 | #264 | Tragic 19.7% |
| Immigrants | Jamaica | 0.1 /100 | #265 | Tragic 19.8% |
| Spanish Americans | 0.1 /100 | #266 | Tragic 19.8% |
| Immigrants | Bangladesh | 0.1 /100 | #267 | Tragic 19.9% |
| Spanish American Indians | 0.1 /100 | #268 | Tragic 19.9% |
| Liberians | 0.1 /100 | #269 | Tragic 19.9% |
| Cherokee | 0.1 /100 | #270 | Tragic 19.9% |
| Immigrants | Barbados | 0.1 /100 | #271 | Tragic 19.9% |
| Immigrants | El Salvador | 0.1 /100 | #272 | Tragic 20.0% |
| Bangladeshis | 0.1 /100 | #273 | Tragic 20.0% |
| Immigrants | St. Vincent and the Grenadines | 0.0 /100 | #274 | Tragic 20.1% |