Immigrants from Eastern Asia vs Immigrants from Lebanon Poverty
COMPARE
Immigrants from Eastern Asia
Immigrants from Lebanon
Poverty
Poverty Comparison
Immigrants from Eastern Asia
Immigrants from Lebanon
11.3%
POVERTY
96.7/ 100
METRIC RATING
77th/ 347
METRIC RANK
12.8%
POVERTY
18.7/ 100
METRIC RATING
197th/ 347
METRIC RANK
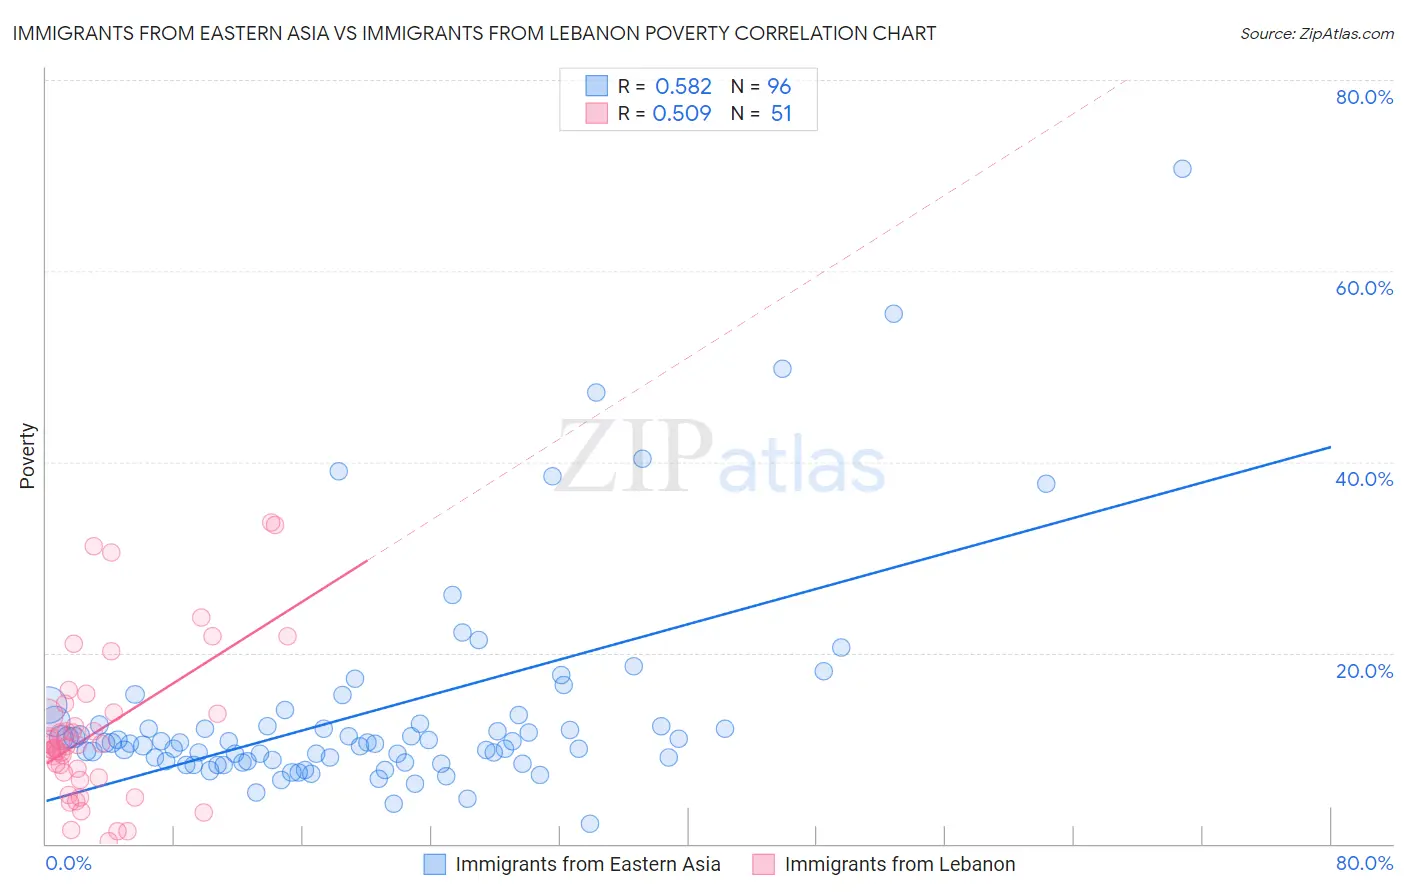
Immigrants from Eastern Asia vs Immigrants from Lebanon Poverty Correlation Chart
The statistical analysis conducted on geographies consisting of 499,367,398 people shows a substantial positive correlation between the proportion of Immigrants from Eastern Asia and poverty level in the United States with a correlation coefficient (R) of 0.582 and weighted average of 11.3%. Similarly, the statistical analysis conducted on geographies consisting of 217,129,888 people shows a substantial positive correlation between the proportion of Immigrants from Lebanon and poverty level in the United States with a correlation coefficient (R) of 0.509 and weighted average of 12.8%, a difference of 12.8%.
Poverty Correlation Summary
| Measurement | Immigrants from Eastern Asia | Immigrants from Lebanon |
| Minimum | 2.1% | 0.24% |
| Maximum | 70.7% | 33.6% |
| Range | 68.7% | 33.4% |
| Mean | 13.9% | 11.8% |
| Median | 10.6% | 10.2% |
| Interquartile 25% (IQ1) | 8.6% | 6.9% |
| Interquartile 75% (IQ3) | 12.5% | 13.7% |
| Interquartile Range (IQR) | 3.8% | 6.8% |
| Standard Deviation (Sample) | 11.2% | 8.0% |
| Standard Deviation (Population) | 11.2% | 7.9% |
Similar Demographics by Poverty
Demographics Similar to Immigrants from Eastern Asia by Poverty
In terms of poverty, the demographic groups most similar to Immigrants from Eastern Asia are Dutch (11.3%, a difference of 0.010%), Cambodian (11.3%, a difference of 0.060%), Immigrants from North America (11.3%, a difference of 0.070%), Indian (Asian) (11.3%, a difference of 0.080%), and Irish (11.3%, a difference of 0.080%).
| Demographics | Rating | Rank | Poverty |
| Immigrants | Canada | 97.3 /100 | #70 | Exceptional 11.3% |
| Zimbabweans | 97.3 /100 | #71 | Exceptional 11.3% |
| Europeans | 97.2 /100 | #72 | Exceptional 11.3% |
| Immigrants | Belgium | 97.2 /100 | #73 | Exceptional 11.3% |
| Carpatho Rusyns | 97.2 /100 | #74 | Exceptional 11.3% |
| Immigrants | Eastern Europe | 97.0 /100 | #75 | Exceptional 11.3% |
| Immigrants | North America | 96.8 /100 | #76 | Exceptional 11.3% |
| Immigrants | Eastern Asia | 96.7 /100 | #77 | Exceptional 11.3% |
| Dutch | 96.7 /100 | #78 | Exceptional 11.3% |
| Cambodians | 96.7 /100 | #79 | Exceptional 11.3% |
| Indians (Asian) | 96.6 /100 | #80 | Exceptional 11.3% |
| Irish | 96.6 /100 | #81 | Exceptional 11.3% |
| Egyptians | 96.5 /100 | #82 | Exceptional 11.3% |
| Immigrants | Sweden | 96.3 /100 | #83 | Exceptional 11.3% |
| English | 96.3 /100 | #84 | Exceptional 11.3% |
Demographics Similar to Immigrants from Lebanon by Poverty
In terms of poverty, the demographic groups most similar to Immigrants from Lebanon are Spanish (12.8%, a difference of 0.010%), Immigrants from Kenya (12.8%, a difference of 0.20%), Iraqi (12.7%, a difference of 0.31%), Immigrants from Kuwait (12.7%, a difference of 0.32%), and Spaniard (12.8%, a difference of 0.35%).
| Demographics | Rating | Rank | Poverty |
| Immigrants | South America | 32.3 /100 | #190 | Fair 12.5% |
| Sierra Leoneans | 31.5 /100 | #191 | Fair 12.6% |
| South American Indians | 23.3 /100 | #192 | Fair 12.7% |
| Delaware | 21.4 /100 | #193 | Fair 12.7% |
| Arabs | 21.1 /100 | #194 | Fair 12.7% |
| Immigrants | Kuwait | 20.9 /100 | #195 | Fair 12.7% |
| Iraqis | 20.8 /100 | #196 | Fair 12.7% |
| Immigrants | Lebanon | 18.7 /100 | #197 | Poor 12.8% |
| Spanish | 18.7 /100 | #198 | Poor 12.8% |
| Immigrants | Kenya | 17.5 /100 | #199 | Poor 12.8% |
| Spaniards | 16.5 /100 | #200 | Poor 12.8% |
| Immigrants | Uganda | 16.5 /100 | #201 | Poor 12.8% |
| Immigrants | Uruguay | 15.6 /100 | #202 | Poor 12.8% |
| Hmong | 15.0 /100 | #203 | Poor 12.8% |
| Immigrants | Western Asia | 14.1 /100 | #204 | Poor 12.9% |