Immigrants from Dominican Republic vs Ghanaian Male Poverty
COMPARE
Immigrants from Dominican Republic
Ghanaian
Male Poverty
Male Poverty Comparison
Immigrants from Dominican Republic
Ghanaians
16.2%
MALE POVERTY
0.0/ 100
METRIC RATING
330th/ 347
METRIC RANK
12.7%
MALE POVERTY
0.4/ 100
METRIC RATING
239th/ 347
METRIC RANK
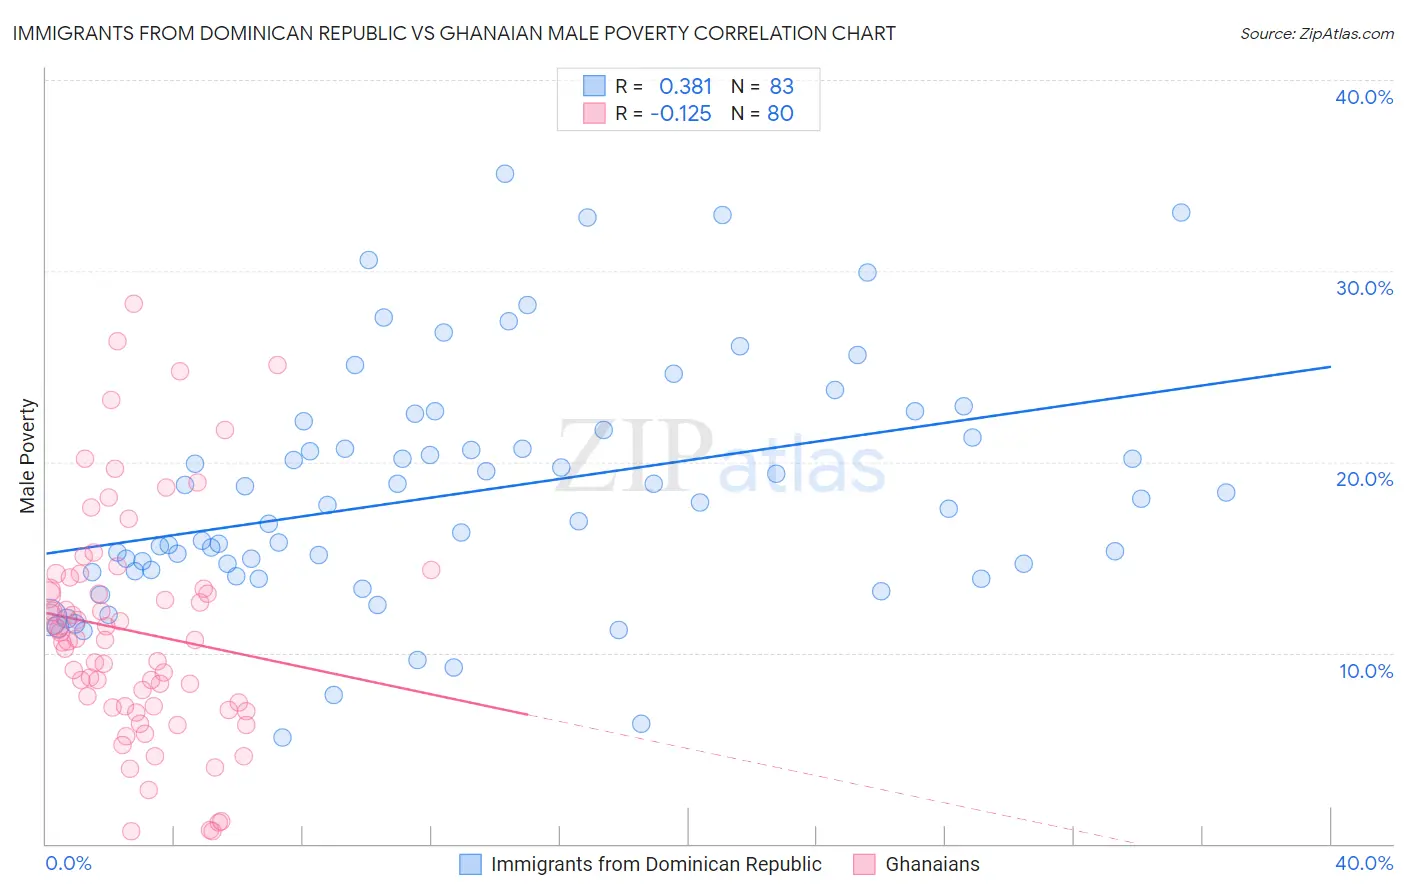
Immigrants from Dominican Republic vs Ghanaian Male Poverty Correlation Chart
The statistical analysis conducted on geographies consisting of 274,910,584 people shows a mild positive correlation between the proportion of Immigrants from Dominican Republic and poverty level among males in the United States with a correlation coefficient (R) of 0.381 and weighted average of 16.2%. Similarly, the statistical analysis conducted on geographies consisting of 190,493,527 people shows a poor negative correlation between the proportion of Ghanaians and poverty level among males in the United States with a correlation coefficient (R) of -0.125 and weighted average of 12.7%, a difference of 27.6%.
Male Poverty Correlation Summary
| Measurement | Immigrants from Dominican Republic | Ghanaian |
| Minimum | 5.5% | 0.62% |
| Maximum | 35.1% | 28.3% |
| Range | 29.5% | 27.6% |
| Mean | 18.4% | 11.1% |
| Median | 17.7% | 10.7% |
| Interquartile 25% (IQ1) | 14.2% | 7.2% |
| Interquartile 75% (IQ3) | 21.7% | 13.6% |
| Interquartile Range (IQR) | 7.5% | 6.5% |
| Standard Deviation (Sample) | 6.2% | 6.0% |
| Standard Deviation (Population) | 6.2% | 5.9% |
Similar Demographics by Male Poverty
Demographics Similar to Immigrants from Dominican Republic by Male Poverty
In terms of male poverty, the demographic groups most similar to Immigrants from Dominican Republic are Ute (16.2%, a difference of 0.34%), Dominican (16.1%, a difference of 0.65%), Black/African American (15.8%, a difference of 2.4%), Paiute (15.8%, a difference of 2.4%), and Houma (16.7%, a difference of 3.3%).
| Demographics | Rating | Rank | Male Poverty |
| Colville | 0.0 /100 | #323 | Tragic 15.2% |
| Menominee | 0.0 /100 | #324 | Tragic 15.3% |
| Yakama | 0.0 /100 | #325 | Tragic 15.3% |
| Central American Indians | 0.0 /100 | #326 | Tragic 15.3% |
| Paiute | 0.0 /100 | #327 | Tragic 15.8% |
| Blacks/African Americans | 0.0 /100 | #328 | Tragic 15.8% |
| Dominicans | 0.0 /100 | #329 | Tragic 16.1% |
| Immigrants | Dominican Republic | 0.0 /100 | #330 | Tragic 16.2% |
| Ute | 0.0 /100 | #331 | Tragic 16.2% |
| Houma | 0.0 /100 | #332 | Tragic 16.7% |
| Natives/Alaskans | 0.0 /100 | #333 | Tragic 16.9% |
| Cheyenne | 0.0 /100 | #334 | Tragic 17.6% |
| Apache | 0.0 /100 | #335 | Tragic 17.7% |
| Pueblo | 0.0 /100 | #336 | Tragic 18.5% |
| Sioux | 0.0 /100 | #337 | Tragic 18.7% |
Demographics Similar to Ghanaians by Male Poverty
In terms of male poverty, the demographic groups most similar to Ghanaians are Ecuadorian (12.7%, a difference of 0.0%), French American Indian (12.7%, a difference of 0.030%), Immigrants from Saudi Arabia (12.7%, a difference of 0.080%), Immigrants from Middle Africa (12.7%, a difference of 0.27%), and Immigrants from Laos (12.6%, a difference of 0.33%).
| Demographics | Rating | Rank | Male Poverty |
| Nicaraguans | 0.6 /100 | #232 | Tragic 12.6% |
| Fijians | 0.6 /100 | #233 | Tragic 12.6% |
| Immigrants | Armenia | 0.6 /100 | #234 | Tragic 12.6% |
| Immigrants | Laos | 0.5 /100 | #235 | Tragic 12.6% |
| Immigrants | Saudi Arabia | 0.4 /100 | #236 | Tragic 12.7% |
| French American Indians | 0.4 /100 | #237 | Tragic 12.7% |
| Ecuadorians | 0.4 /100 | #238 | Tragic 12.7% |
| Ghanaians | 0.4 /100 | #239 | Tragic 12.7% |
| Immigrants | Middle Africa | 0.4 /100 | #240 | Tragic 12.7% |
| Sudanese | 0.3 /100 | #241 | Tragic 12.8% |
| Nepalese | 0.3 /100 | #242 | Tragic 12.8% |
| Alaskan Athabascans | 0.3 /100 | #243 | Tragic 12.8% |
| Tsimshian | 0.3 /100 | #244 | Tragic 12.8% |
| Liberians | 0.3 /100 | #245 | Tragic 12.8% |
| Immigrants | El Salvador | 0.2 /100 | #246 | Tragic 12.8% |