Immigrants from Dominican Republic vs Ghanaian In Labor Force | Age 16-19
COMPARE
Immigrants from Dominican Republic
Ghanaian
In Labor Force | Age 16-19
In Labor Force | Age 16-19 Comparison
Immigrants from Dominican Republic
Ghanaians
31.1%
IN LABOR FORCE | AGE 16-19
0.0/ 100
METRIC RATING
326th/ 347
METRIC RANK
35.3%
IN LABOR FORCE | AGE 16-19
6.5/ 100
METRIC RATING
223rd/ 347
METRIC RANK
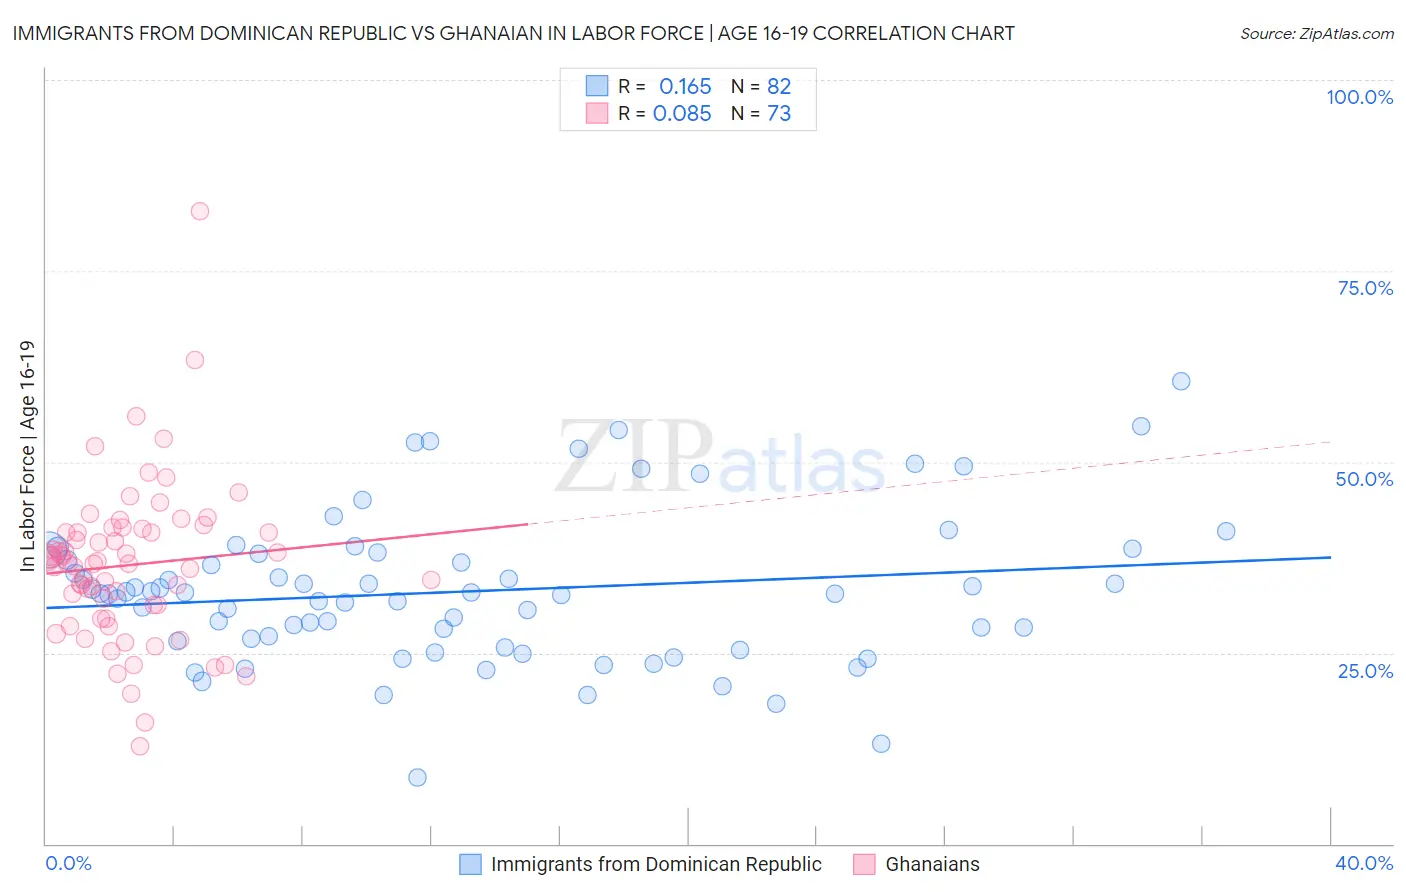
Immigrants from Dominican Republic vs Ghanaian In Labor Force | Age 16-19 Correlation Chart
The statistical analysis conducted on geographies consisting of 274,798,225 people shows a poor positive correlation between the proportion of Immigrants from Dominican Republic and labor force participation rate among population between the ages 16 and 19 in the United States with a correlation coefficient (R) of 0.165 and weighted average of 31.1%. Similarly, the statistical analysis conducted on geographies consisting of 190,615,931 people shows a slight positive correlation between the proportion of Ghanaians and labor force participation rate among population between the ages 16 and 19 in the United States with a correlation coefficient (R) of 0.085 and weighted average of 35.3%, a difference of 13.7%.
In Labor Force | Age 16-19 Correlation Summary
| Measurement | Immigrants from Dominican Republic | Ghanaian |
| Minimum | 8.7% | 12.8% |
| Maximum | 60.5% | 82.8% |
| Range | 51.8% | 70.0% |
| Mean | 33.0% | 36.5% |
| Median | 32.7% | 36.7% |
| Interquartile 25% (IQ1) | 26.5% | 30.3% |
| Interquartile 75% (IQ3) | 38.0% | 41.0% |
| Interquartile Range (IQR) | 11.5% | 10.7% |
| Standard Deviation (Sample) | 9.7% | 10.4% |
| Standard Deviation (Population) | 9.7% | 10.4% |
Similar Demographics by In Labor Force | Age 16-19
Demographics Similar to Immigrants from Dominican Republic by In Labor Force | Age 16-19
In terms of in labor force | age 16-19, the demographic groups most similar to Immigrants from Dominican Republic are Immigrants from Taiwan (31.0%, a difference of 0.16%), Immigrants from China (31.1%, a difference of 0.20%), Immigrants from Ecuador (31.0%, a difference of 0.20%), Barbadian (31.0%, a difference of 0.23%), and Dominican (31.2%, a difference of 0.35%).
| Demographics | Rating | Rank | In Labor Force | Age 16-19 |
| Soviet Union | 0.0 /100 | #319 | Tragic 31.4% |
| Ecuadorians | 0.0 /100 | #320 | Tragic 31.4% |
| West Indians | 0.0 /100 | #321 | Tragic 31.3% |
| Tohono O'odham | 0.0 /100 | #322 | Tragic 31.3% |
| Immigrants | Caribbean | 0.0 /100 | #323 | Tragic 31.2% |
| Dominicans | 0.0 /100 | #324 | Tragic 31.2% |
| Immigrants | China | 0.0 /100 | #325 | Tragic 31.1% |
| Immigrants | Dominican Republic | 0.0 /100 | #326 | Tragic 31.1% |
| Immigrants | Taiwan | 0.0 /100 | #327 | Tragic 31.0% |
| Immigrants | Ecuador | 0.0 /100 | #328 | Tragic 31.0% |
| Barbadians | 0.0 /100 | #329 | Tragic 31.0% |
| Lumbee | 0.0 /100 | #330 | Tragic 31.0% |
| Trinidadians and Tobagonians | 0.0 /100 | #331 | Tragic 30.9% |
| Immigrants | Israel | 0.0 /100 | #332 | Tragic 30.5% |
| Immigrants | Hong Kong | 0.0 /100 | #333 | Tragic 30.5% |
Demographics Similar to Ghanaians by In Labor Force | Age 16-19
In terms of in labor force | age 16-19, the demographic groups most similar to Ghanaians are Honduran (35.3%, a difference of 0.020%), Immigrants from Belgium (35.3%, a difference of 0.090%), Immigrants from Ghana (35.4%, a difference of 0.15%), Turkish (35.4%, a difference of 0.16%), and Immigrants from Guatemala (35.3%, a difference of 0.19%).
| Demographics | Rating | Rank | In Labor Force | Age 16-19 |
| Dutch West Indians | 10.7 /100 | #216 | Poor 35.6% |
| Immigrants | Costa Rica | 10.7 /100 | #217 | Poor 35.6% |
| Sri Lankans | 9.8 /100 | #218 | Tragic 35.5% |
| Guatemalans | 8.6 /100 | #219 | Tragic 35.5% |
| Immigrants | Bahamas | 8.3 /100 | #220 | Tragic 35.5% |
| Turks | 7.3 /100 | #221 | Tragic 35.4% |
| Immigrants | Ghana | 7.3 /100 | #222 | Tragic 35.4% |
| Ghanaians | 6.5 /100 | #223 | Tragic 35.3% |
| Hondurans | 6.5 /100 | #224 | Tragic 35.3% |
| Immigrants | Belgium | 6.1 /100 | #225 | Tragic 35.3% |
| Immigrants | Guatemala | 5.7 /100 | #226 | Tragic 35.3% |
| Mongolians | 5.7 /100 | #227 | Tragic 35.3% |
| Immigrants | Senegal | 5.5 /100 | #228 | Tragic 35.3% |
| Immigrants | Lebanon | 5.0 /100 | #229 | Tragic 35.2% |
| Immigrants | Honduras | 4.9 /100 | #230 | Tragic 35.2% |